Page 1 of 1
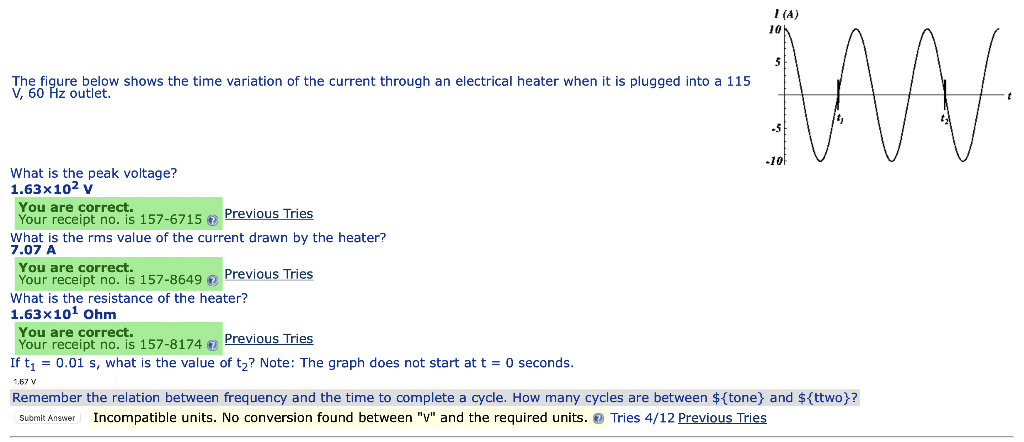
(A) 10 The figure below shows the time variation of the current through an electrical heater when it is plugged into a 1
Posted: Wed May 18, 2022 7:01 am
by answerhappygod
- A 10 The Figure Below Shows The Time Variation Of The Current Through An Electrical Heater When It Is Plugged Into A 1 1 (191.34 KiB) Viewed 39 times
(A) 10 The figure below shows the time variation of the current through an electrical heater when it is plugged into a 115 V, 60 Hz outlet. 3 -101 What is the peak voltage? 1.63x10² v You are correct. Your receipt no. is 157-6715 Previous Tries What is the rms value of the current drawn by the heater? 7.07 A You are correct. Your receipt no. is 157-8649 Previous Tries is the resistance of the heater? 1.63x101 Ohm You are correct. Your receipt no. is 157-8174 Previous Tries If tı = 0.01 s, what is the value of tz? Note: The graph does not start at t = 0 seconds. What 1.67 V Remember the relation between frequency and the time to complete a cycle. How many cycles are between ${tone) and ${ttwo}? Submit Answer Incompatible units. No conversion found between "V" and the required units. Tries 4/12 Previous Tries