Page 1 of 1
This problem sheet asks you to prove some well known results. Although the algebra is easy the proofs are not entirely s
Posted: Tue May 17, 2022 9:41 pm
by answerhappygod
- This Problem Sheet Asks You To Prove Some Well Known Results Although The Algebra Is Easy The Proofs Are Not Entirely S 1 (96.34 KiB) Viewed 74 times
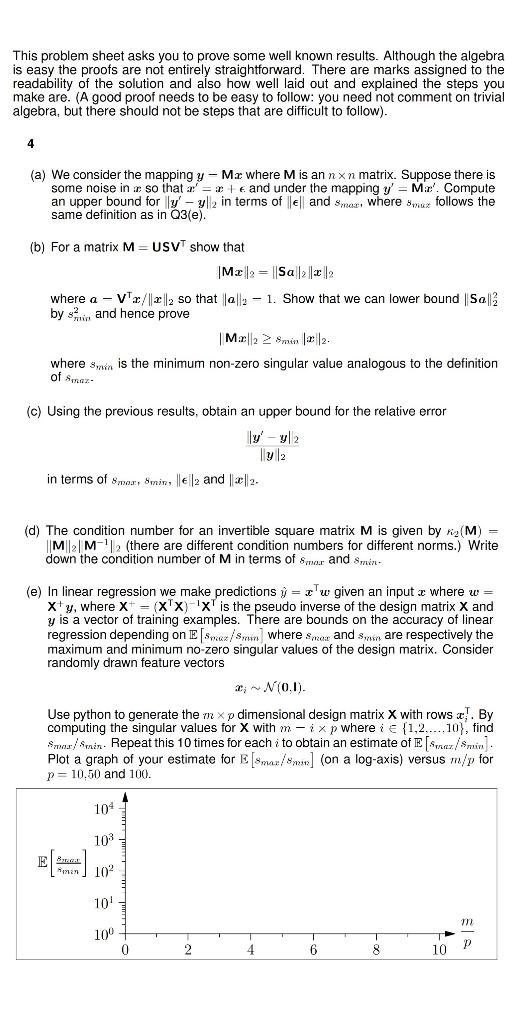
This problem sheet asks you to prove some well known results. Although the algebra is easy the proofs are not entirely straightforward. There are marks assigned to the readability of the solution and also how well laid out and explained the steps you make are. (A good proof needs to be easy to follow: you need not comment on trivial algebra, but there should not be steps that are difficult to follow). 4 (a) We consider the mapping y - Mx where M is an nxn matrix. Suppose there is some noise in do so that ' = :te and under the mapping v' = Mir'. Compute an upper bound for y - y2 in terms of lell and smar, where Bmw follows the same definition as in Q3(e). (b) For a matrix M=USV show that |M2|2 = |Sa> | 22 where a - V' / || 2 |2 so that |||2 - 1. Show that we can lower bound Sa 2 by sun and hence prove M2 > min 2. where Swin is the minimum non-zero singular value analogous to the definition of Sex (c) Using the previous results, obtain an upper bound for the relative error ||- M| 2 in terms of som, Smin || |2 and 22. (d) The condition number for an invertible square matrix M is given by riz(M) = M2M-'12 (there are different condition numbers for different norms.) Write down the condition number of M in terms of Smor and min (e) in linear regression we make predictions y = Z'w given an input x where w= x+y, where X+ = (X'X) 'x' is the pseudo inverse of the design matrix X and y is a vector of training examples. There are bounds on the accuracy of linear regression depending on E (max/minwhere Smer and Smm are respectively the maximum and minimum no-zero singular values of the design matrix. Consider randomly drawn feature vectors #;-N10.11. Use python to generate the m xp dimensional design matrix X with rows x. By computing the singular values for X with mixp where i c {1,2....,10), find Smur/ Smin. Repeat this 10 times for each i to obtain an estimate of E [Sez./ Smin Plot a graph of your estimate for E [Smar/omun] (on a log-axis) versus m/p for p=10.50 and 100. 104 103 Laman 10 10 12 100 0 TL 10 2 4 6 8 P