Page 1 of 1
1. The following data were collected from a pumping test conducted in a confined aquifer where a well was pumped at a ra
Posted: Tue May 17, 2022 8:32 pm
by answerhappygod
- 1 The Following Data Were Collected From A Pumping Test Conducted In A Confined Aquifer Where A Well Was Pumped At A Ra 1 (51.62 KiB) Viewed 42 times
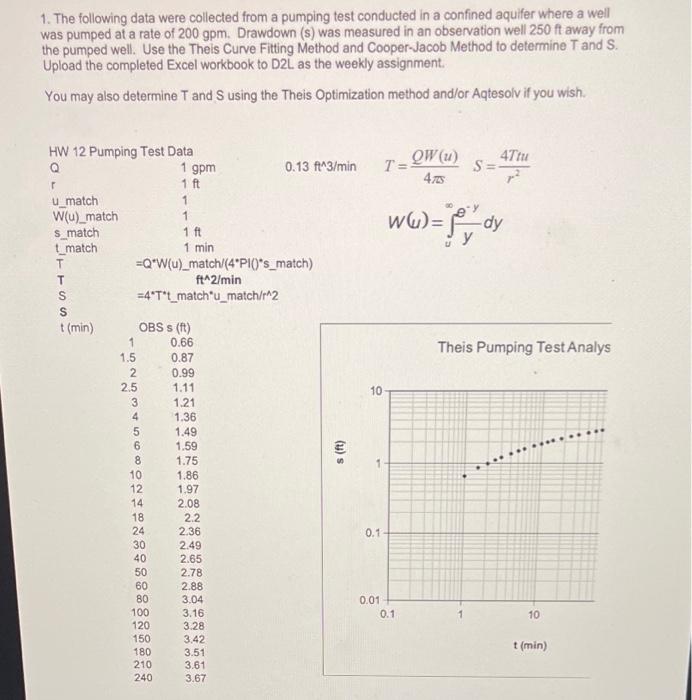
1. The following data were collected from a pumping test conducted in a confined aquifer where a well was pumped at a rate of 200 gpm. Drawdown (s) was measured in an observation well 250 ft away from the pumped well. Use the Theis Curve Fitting Method and Cooper Jacob Method to determine T and S. Upload the completed Excel workbook to D21. as the weekly assignment You may also determine T and S using the Theis Optimization method and/or Aqtesolv if you wish 7 - QW (U) S = 47 tu m2 47 ww)= dy Theis Pumping Test Analys HW 12 Pumping Test Data Q 1 gpm 0.13 f^3/min 1 ft u_match 1 W(u)_match 1 s_match 1 ft 1 match 1 min т =Q*W(u)_match/(4*P10's_match) т ft^2/min S =4"T"t_match"u_match/r^2 S t(min) OBS s (ft) 1 0.66 1.5 0.87 2 0.99 2.5 1.11 10 3 1.21 4 1.36 5 1.49 6 1.59 8 1.75 10 1.86 12 1.97 14 2.08 18 2.2 24 2.36 0.1 30 2.49 40 2.65 50 2.78 60 2.88 80 3.04 0.01 100 3.16 0.1 120 3.28 150 3.42 180 3.51 210 3.61 240 3.67 (u) 10 t (min)