Page 1 of 1
Q2- Plot the load-efficiency curve for the following motor on a graph paper with distinct points as requested. For how m
Posted: Tue May 17, 2022 8:10 pm
by answerhappygod
- Q2 Plot The Load Efficiency Curve For The Following Motor On A Graph Paper With Distinct Points As Requested For How M 1 (46.63 KiB) Viewed 103 times
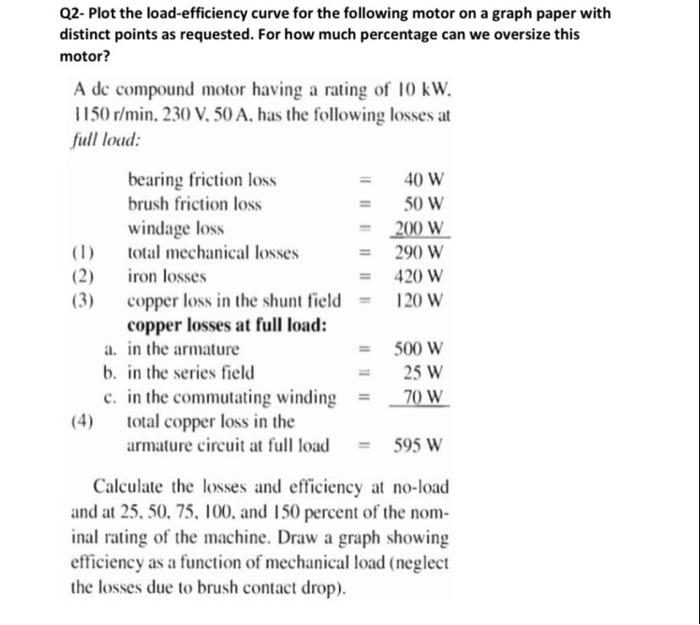
Q2- Plot the load-efficiency curve for the following motor on a graph paper with distinct points as requested. For how much percentage can we oversize this motor? A dc compound motor having a rating of 10 kW. 1150 r/min. 230 V. 50 A, has the following losses at full loud: 40 W 50 W 200 W 290 W 420 W 120 W (1) (2) (3) bearing friction loss brush friction loss windage loss total mechanical losses iron losses copper loss in the shunt field = copper losses at full load: a. in the armature b. in the series field c. in the commutating winding total copper loss in the armature circuit at full load 500 W 25 W 70 W 595 W Calculate the losses and efficiency at no-load and at 25, 50, 75, 100, and 150 percent of the nom- inal rating of the machine. Draw a graph showing efficiency as a function of mechanical load (neglect the losses due to brush contact drop).