Page 1 of 1
2. The following map shows altitudes (in meters) and temperatures (in deg. C) of the 700 mb pressure level. From this ma
Posted: Tue May 17, 2022 7:22 pm
by answerhappygod
- 2 The Following Map Shows Altitudes In Meters And Temperatures In Deg C Of The 700 Mb Pressure Level From This Ma 1 (37.95 KiB) Viewed 123 times
- 2 The Following Map Shows Altitudes In Meters And Temperatures In Deg C Of The 700 Mb Pressure Level From This Ma 2 (29.46 KiB) Viewed 123 times
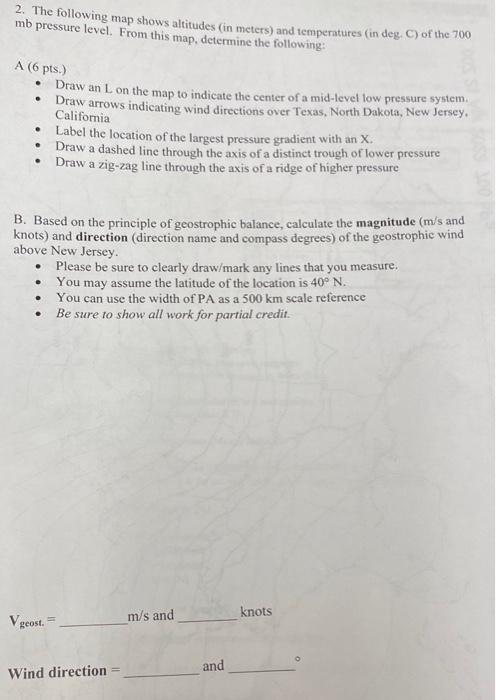
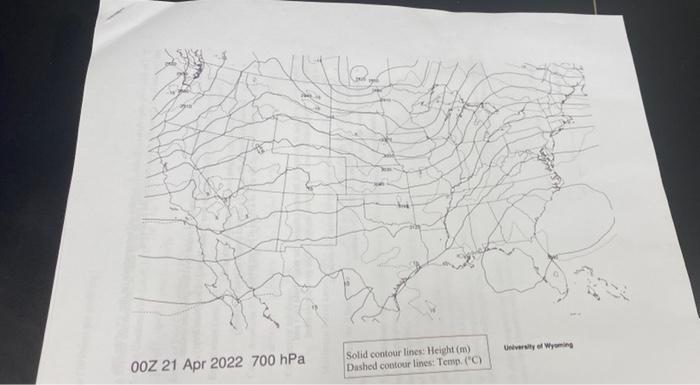
2. The following map shows altitudes (in meters) and temperatures (in deg. C) of the 700 mb pressure level. From this map, determine the following: A (6 pts.) . . Draw an L on the map to indicate the center of a mid-level low pressure system Draw arrows indicating wind directions over Texas, North Dakota, New Jersey. Califomia Label the location of the largest pressure gradient with an X Draw a dashed line through the axis of a distinct trough of lower pressure Draw a zig-zag line through the axis of a ridge of higher pressure . . B. Based on the principle of geostrophic balance, calculate the magnitude (m/s and knots) and direction (direction name and compass degrees) of the geostrophic wind above New Jersey. Please be sure to clearly draw/mark any lines that you measure. You may assume the latitude of the location is 40°N. You can use the width of PA as a 500 km scale reference Be sure to show all work for partial credit. . knots V geost. m/s and and Wind direction
University of Wyoming 00Z 21 Apr 2022 700 hPa Solid contour lines: Height (m) Dashed contour lines: Temp. ("C)