Page 1 of 1
Question 3 (HPLC) [20 Marks] The graph shows retention data for separation of three compounds using a 15 cm x 0.46 cm di
Posted: Tue May 17, 2022 6:23 am
by answerhappygod
- Question 3 Hplc 20 Marks The Graph Shows Retention Data For Separation Of Three Compounds Using A 15 Cm X 0 46 Cm Di 1 (49.14 KiB) Viewed 62 times
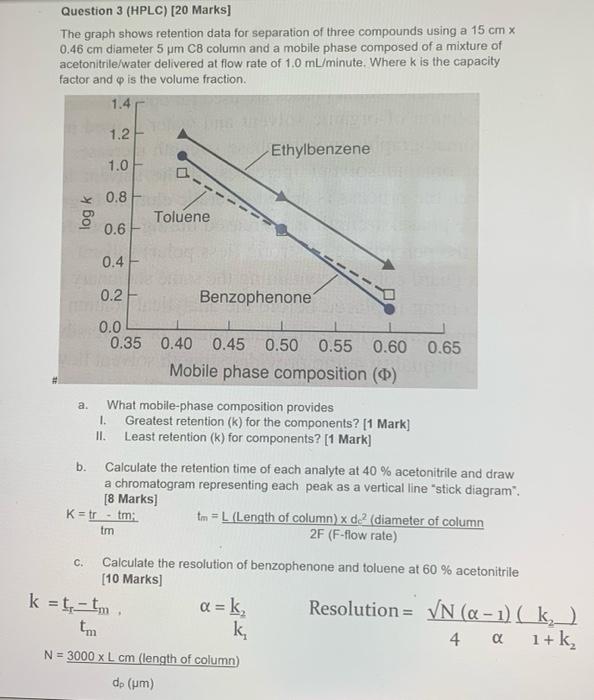
Question 3 (HPLC) [20 Marks] The graph shows retention data for separation of three compounds using a 15 cm x 0.46 cm diameter 5 pm CB column and a mobile phase composed of a mixture of acetonitrile/water delivered at flow rate of 1.0 mL/minute. Where k is the capacity factor and is the volume fraction. 1.4 1.2 Ethylbenzene 1.0 0.8 log k Toluene 0.6 0.4 0.2 Benzophenone 0.0 0.35 0.40 0.45 0.50 0.55 0.60 0.65 Mobile phase composition (0) a. What mobile-phase composition provides I. Greatest retention (k) for the components? [1 Mark) II. Least retention (k) for components? [1 Mark] b. Calculate the retention time of each analyte at 40 % acetonitrile and draw a chromatogram representing each peak as a vertical line "stick diagram". [8 Marks) K = tr - tm; tm = L (Length of column) x de? (diameter of column tm 2F (F-flow rate) Calculate the resolution of benzophenone and toluene at 60 % acetonitrile [10 Marks) a = k, Resolution= VN (Q - 1) ( k) k, 4 α 1+k, N = 3000 x L cm (length of column) dp (um) C. k = t-tm