Page 1 of 1
1. For the following data, submit a scatterplot. x: 10 5 13 6 15 13 4 3 12 10 16 18 11 16 4 13 4 16 14 15 Y: -8 1-17-3-2
Posted: Sun Sep 05, 2021 5:01 pm
by answerhappygod
- 1 For The Following Data Submit A Scatterplot X 10 5 13 6 15 13 4 3 12 10 16 18 11 16 4 13 4 16 14 15 Y 8 1 17 3 2 1 (33.75 KiB) Viewed 622 times
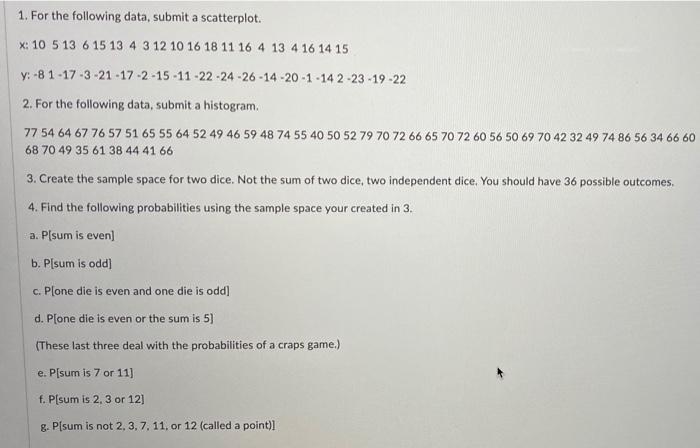
1. For the following data, submit a scatterplot. x: 10 5 13 6 15 13 4 3 12 10 16 18 11 16 4 13 4 16 14 15 Y: -8 1-17-3-21-17-2-15-11-22-24-26-14-20-1 -142-23-19-22 2. For the following data, submit a histogram. 77 54 64 67 76 57 51 65 55 64 52 49 46 59 48 74 55 40 50 52 79 70 72 66 65 70 72 60 56 50 69 7042 32 49 74 86 56 34 66 60 68 70 49 35 61 38 44 41 66 3. Create the sample space for two dice. Not the sum of two dice, two independent dice. You should have 36 possible outcomes. 4. Find the following probabilities using the sample space your created in 3. a. Psum is even) b. P[sum is odd) c. Plone die is even and one die is odd] d. Plone die is even or the sum is 5) (These last three deal with the probabilities of a craps game.) e. P[sum is 7 or 11] f. Písum is 2.3 or 12] 8. P[sum is not 2.3.7. 11. or 12 (called a point)