Page 1 of 1
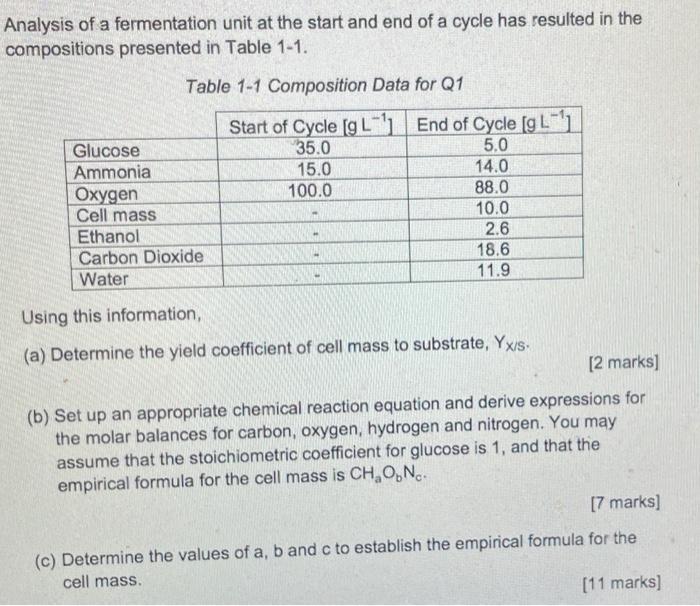
Analysis of a fermentation unit at the start and end of a cycle has resulted in the compositions presented in Table 1-1.
Posted: Mon May 16, 2022 10:28 pm
by answerhappygod
- Analysis Of A Fermentation Unit At The Start And End Of A Cycle Has Resulted In The Compositions Presented In Table 1 1 1 (76.99 KiB) Viewed 41 times
Analysis of a fermentation unit at the start and end of a cycle has resulted in the compositions presented in Table 1-1. Table 1-1 Composition Data for Q1 Start of Cycle [g L-) End of Cycle [g L-'1 Glucose 35.0 5.0 Ammonia 15.0 14.0 Oxygen 100.0 88.0 Cell mass 10.0 Ethanol 2.6 Carbon Dioxide 18.6 Water 11.9 Using this information, (a) Determine the yield coefficient of cell mass to substrate, Yx/s. [2 marks] (b) Set up an appropriate chemical reaction equation and derive expressions for the molar balances for carbon, oxygen, hydrogen and nitrogen. You may assume that the stoichiometric coefficient for glucose is 1, and that the empirical formula for the cell mass is CHON. [7 marks] (c) Determine the values of a, b and c to establish the empirical formula for the cell mass [11 marks]