Page 1 of 1
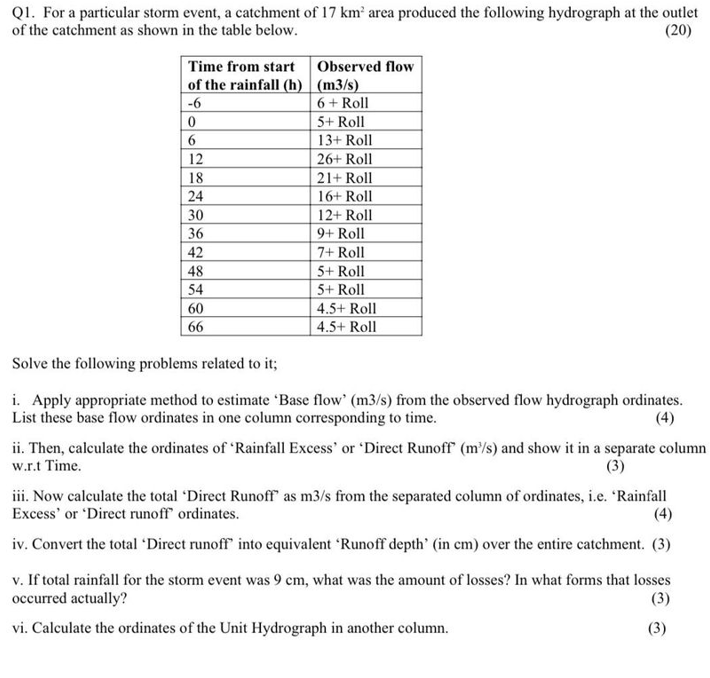
Q1. For a particular storm event, a catchment of 17 km'area produced the following hydrograph at the outlet of the catch
Posted: Mon May 16, 2022 12:10 pm
by answerhappygod
- Q1 For A Particular Storm Event A Catchment Of 17 Km Area Produced The Following Hydrograph At The Outlet Of The Catch 1 (183.62 KiB) Viewed 46 times
Q1. For a particular storm event, a catchment of 17 km'area produced the following hydrograph at the outlet of the catchment as shown in the table below. (20) Time from start Observed flow of the rainfall (h) (m3/s) -6 6 + Roll 0 5+ Roll 6 13+ Roll 12 26+ Roll 18 21+ Roll 24 16+ Roll 30 12+ Roll 36 9+ Roll 42 7+ Roll 48 5+ Roll 54 5+ Roll 60 4.5+ Roll 66 4.5+ Roll (4) Solve the following problems related to it; i. Apply appropriate method to estimate 'Base flow' (m3/s) from the observed flow hydrograph ordinates. List these base flow ordinates in one column corresponding to time. ii. Then, calculate the ordinates of 'Rainfall Excess' or 'Direct Runoff (m/s) and show it in a separate column W.r.t Time. (3) iii. Now calculate the total 'Direct Runoff as m3/s from the separated column of ordinates, i.e. "Rainfall Excess' or 'Direct runoff ordinates. (4) iv. Convert the total 'Direct runoff into equivalent 'Runoff depth' (in cm) over the entire catchment. (3) v. If total rainfall for the storm event was 9 cm, what was the amount of losses? In what forms that losses occurred actually? (3) vi. Calculate the ordinates of the Unit Hydrograph in another column. (3)