Page 1 of 1
The x-bar and R control charts are used to monitor the thickness of plastic bottle, specifications are at most 95. Twent
Posted: Sun Sep 05, 2021 6:33 am
by answerhappygod
- The X Bar And R Control Charts Are Used To Monitor The Thickness Of Plastic Bottle Specifications Are At Most 95 Twent 1 (21.69 KiB) Viewed 188 times
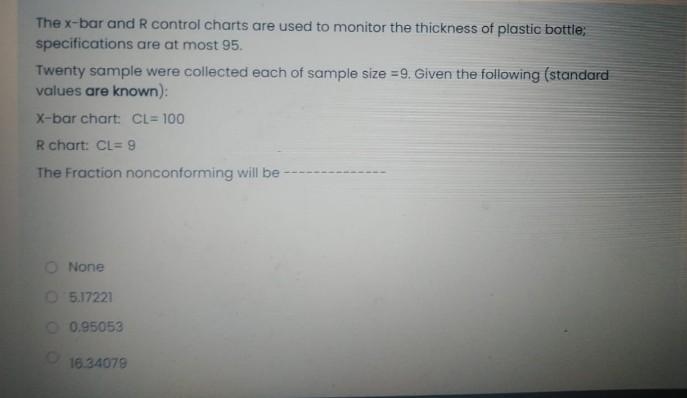
The x-bar and R control charts are used to monitor the thickness of plastic bottle, specifications are at most 95. Twenty sample were collected each of sample size =9. Given the following (standard values are known) X-bar chart: CL=100 R chart: CL= 9 The Fraction nonconforming will be None 05.17221 0.95053 16.34079