Page 1 of 1
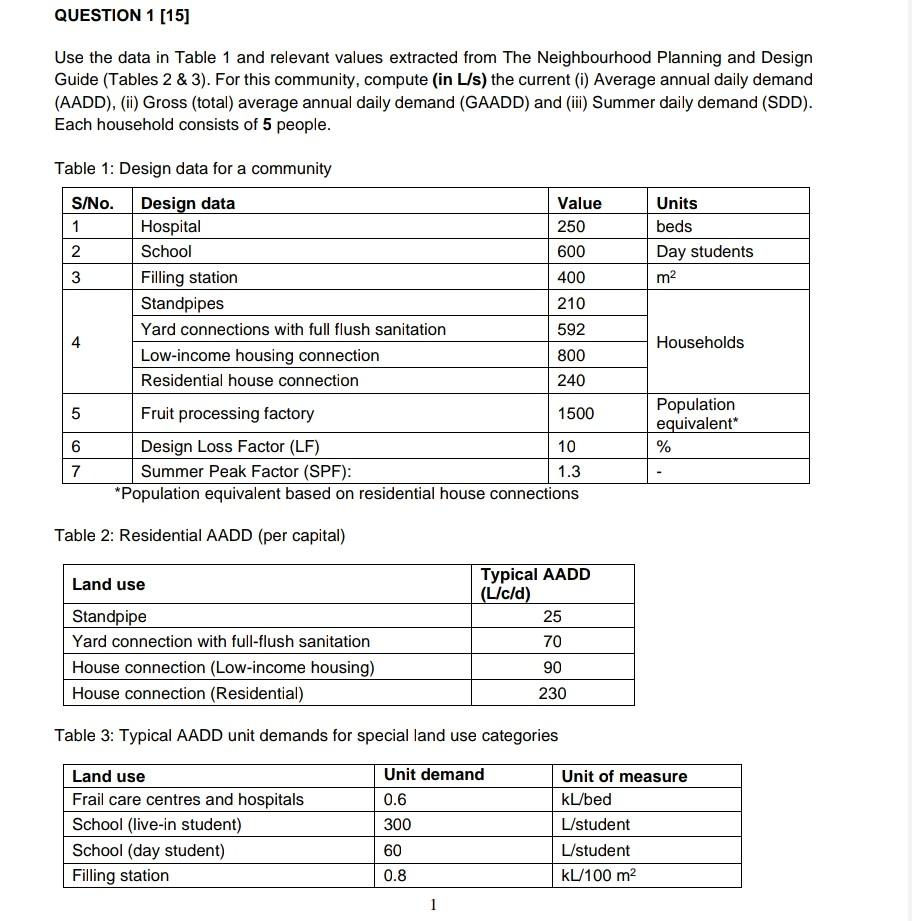
QUESTION 1 [15] Use the data in Table 1 and relevant values extracted from The Neighbourhood Planning and Design Guide (
Posted: Mon May 16, 2022 8:30 am
by answerhappygod
- Question 1 15 Use The Data In Table 1 And Relevant Values Extracted From The Neighbourhood Planning And Design Guide 1 (126.52 KiB) Viewed 71 times
QUESTION 1 [15] Use the data in Table 1 and relevant values extracted from The Neighbourhood Planning and Design Guide (Tables 2 & 3). For this community, compute (in L/s) the current (i) Average annual daily demand (AADD), (ii) Gross (total) average annual daily demand (GAADD) and (ii) Summer daily demand (SDD). Each household consists of 5 people. Units beds Day students m2 Table 1: Design data for a community S/No. Design data Value 1 Hospital 250 2 School 600 3 Filling station 400 Standpipes 210 Yard connections with full flush sanitation 592 4 Low-income housing connection 800 Residential house connection 240 5 Fruit processing factory 1500 6 Design Loss Factor (LF) 10 7 Summer Peak Factor (SPF): 1.3 *Population equivalent based on residential house connections Households Population equivalent % Table 2: Residential AADD (per capital) Land use Standpipe Yard connection with full-flush sanitation House connection (Low-income housing) House connection (Residential) Typical AADD (L/c/d) 25 70 90 230 Table 3: Typical AADD unit demands for special land use categories Land use Frail care centres and hospitals School (live-in student) School (day student) Filling station Unit demand 0.6 300 60 0.8 Unit of measure KL/bed L/student L/student KL/100 m2 1