Page 1 of 1
The variations in wastewater flows received at a wastewater treatment facility from a small community reflect a typical
Posted: Mon May 16, 2022 7:27 am
by answerhappygod
- The Variations In Wastewater Flows Received At A Wastewater Treatment Facility From A Small Community Reflect A Typical 1 (78.96 KiB) Viewed 53 times
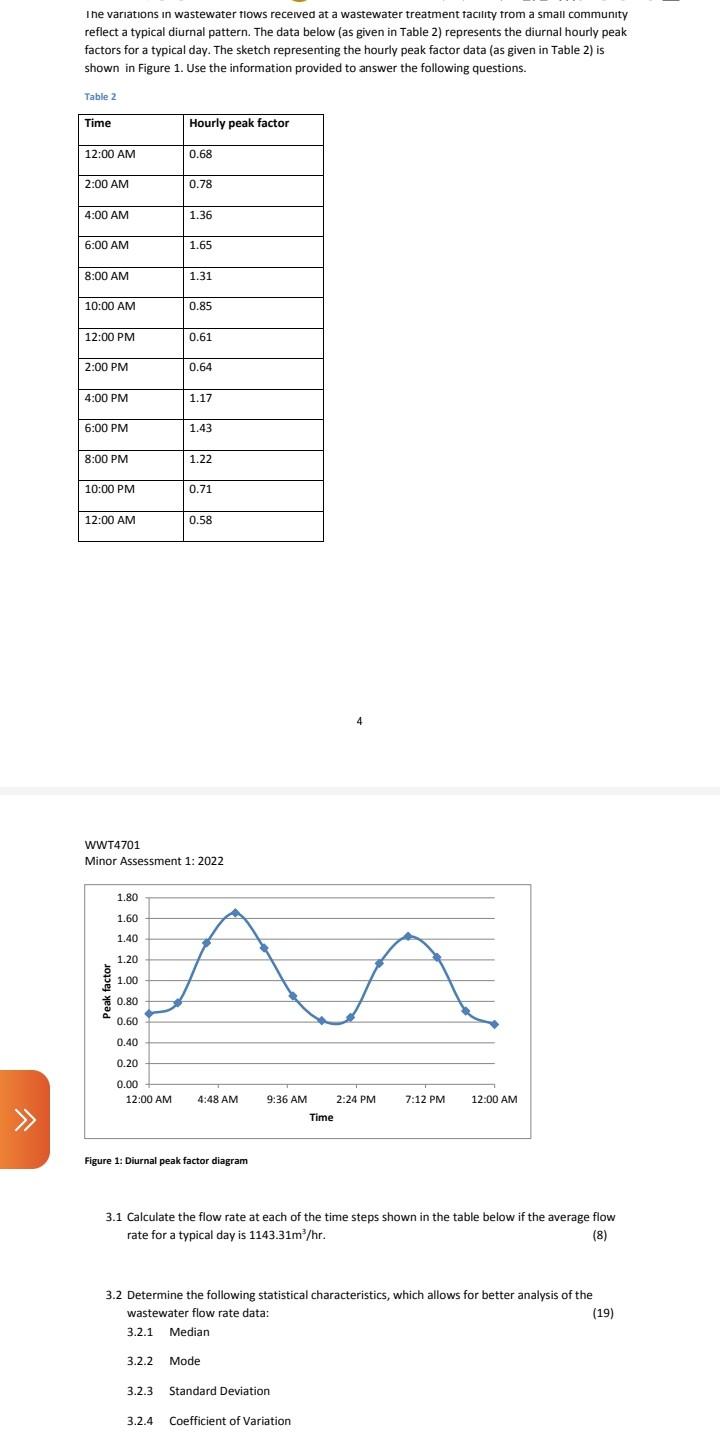
The variations in wastewater flows received at a wastewater treatment facility from a small community reflect a typical diurnal pattern. The data below (as given in Table 2) represents the diurnal hourly peak factors for a typical day. The sketch representing the hourly peak factor data (as given in Table 2) is shown in Figure 1. Use the information provided to answer the following questions. Table 2 Time Hourly peak factor 12:00 AM 0.68 2:00 AM 0.78 4:00 AM 1.36 6:00 AM 1.65 8:00 AM 1.31 10:00 AM 0.85 12:00 PM 0.61 2:00 PM 0.64 4:00 PM 1.17 6:00 PM 1.43 8:00 PM 1.22 10:00 PM 0.71 12:00 AM 0.58 WWT4701 Minor Assessment 1: 2022 1.80 1.60 1.40 1.20 1.00 0.80 0.60 0.40 0.20 0.00 12:00 AM 4:48 AM 9:36 AM 2:24 PM 7:12 PM 12:00 AM Time Figure 1: Diurnal peak factor diagram 3.1 Calculate the flow rate at each of the time steps shown in the table below if the average flow rate for a typical day is 1143.31m/hr. (8) 8 3.2 Determine the following statistical characteristics, which allows for better analysis of the wastewater flow rate data: (19) 3.2.1 Median 3.2.2 Mode 3.2.3 Standard Deviation 3.2.4 Coefficient of Variation