Page 1 of 1
1.80 QUESTION 3 (30 Marks) The variations in wastewater flows received at a wastewater treatment facility from a small c
Posted: Mon May 16, 2022 7:25 am
by answerhappygod
- 1 80 Question 3 30 Marks The Variations In Wastewater Flows Received At A Wastewater Treatment Facility From A Small C 1 (62.73 KiB) Viewed 39 times
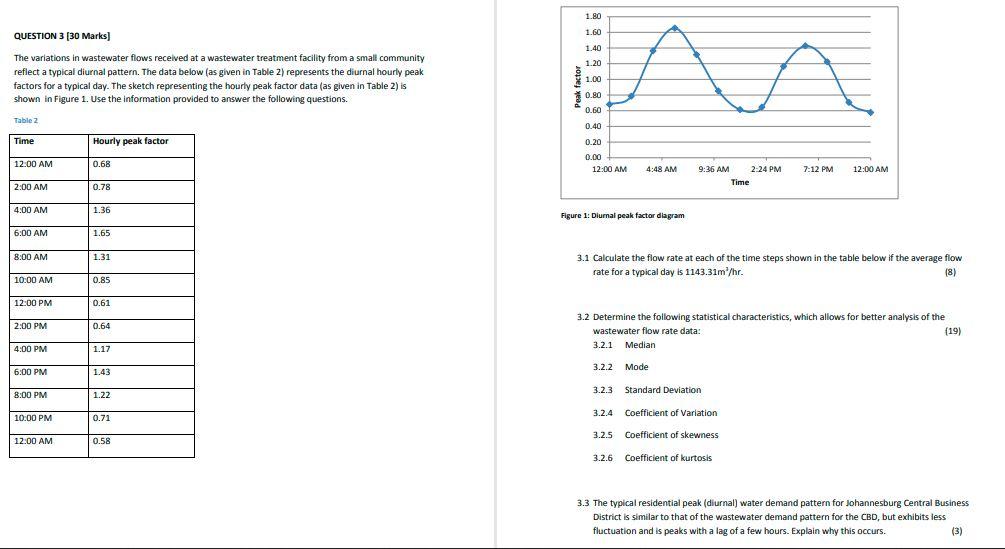
1.80 QUESTION 3 (30 Marks) The variations in wastewater flows received at a wastewater treatment facility from a small community reflect a typical diurnal pattern. The data below (as given in Table 2) represents the diurnal hourly peak factors for a typical day. The sketch representing the hourly peak factor data (as given in Table 2) is shown in Figure 1. Use the information provided to answer the following questions. 1.60 1.40 1.40 1.20 $ 1.00 0.80 0.60 Table 2 0.40 Time Hourly peak factor 0.20 12:00 AM 0.68 0.00 12:00 AM 4:48 AM 7:12 PM 12:00 AM 9:36 AM 2-24 PM Time 2:00 AM 0.78 4:00 AM 1.36 Figure 1: Dlurnal peak factor diagram 6:00 AM 1.65 8:00 AM 1.31 3.1 Calculate the flow rate at each of the time steps shown in the table below if the average flow rate for a typical day is 1143.31m/hr (8) 10:00 AM 0.85 12:00 PM 0.61 2:00 PM 0.64 3.2 Determine the following statistical characteristics, which allows for better analysis of the wastewater flow rate data: (19) 3.2.1 Median 4:00 PM 1.17 3.2.2 Mode 6:00 PM 1.43 8:00 PM 1.22 3.2.3 Standard Deviation 3.2.4 Coefficient of Variation 10:00 PM 0.71 3.2.5 Coefficient of skewness 12:00 AM 0.58 3.2.6 Coefficient of kurtosis 3.3 The typical residential peak (diurnal) water demand pattern for Johannesburg Central Business District is similar to that of the wastewater demand pattern for the CBD, but exhibits less fluctuation and is peaks with a lag of a few hours. Explain why this occurs. (3)