Page 1 of 1
Part D: Statistics and Calculations (CLO 5) 1. You are quality control inspector at Beverages Company X and you want to
Posted: Sun May 15, 2022 10:17 pm
by answerhappygod
- Part D Statistics And Calculations Clo 5 1 You Are Quality Control Inspector At Beverages Company X And You Want To 1 (46.33 KiB) Viewed 72 times
- Part D Statistics And Calculations Clo 5 1 You Are Quality Control Inspector At Beverages Company X And You Want To 2 (13.02 KiB) Viewed 72 times
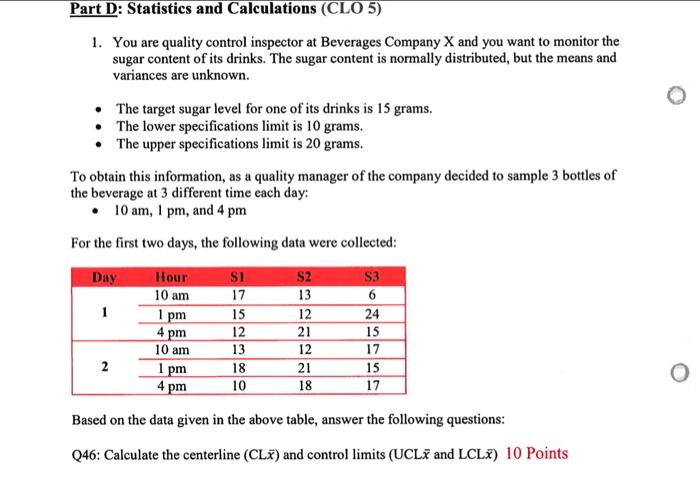
Part D: Statistics and Calculations (CLO 5) 1. You are quality control inspector at Beverages Company X and you want to monitor the sugar content of its drinks. The sugar content is normally distributed, but the means and variances are unknown. • The target sugar level for one of its drinks is 15 grams. • The lower specifications limit is 10 grams. The upper specifications limit is 20 grams. To obtain this information, as a quality manager of the company decided to sample 3 bottles of the beverage at 3 different time each day: • 10 am, 1 pm, and 4 pm For the first two days, the following data were collected: Day 1 Hour 10 am 1 pm 4 pm 10 am 1 pm 4 pm S1 17 15 12 13 18 10 S2 13 12 21 12 21 18 S3 6 24 15 17 15 17 2 Based on the data given in the above table, answer the following questions: Q46: Calculate the centerline (CLX) and control limits (UCLx and LCL) 10 Points
Q47: Calculate the centerline (CLR) and control limits (UCLA and LCLR) 3 Points Q48: Draw the X Chart and R Chart 5 Points