Page 1 of 1
5 Experiment 2: Half-Wave Rectifier S1. Consider the half-wave rectifier circuit in Figure 3(a) with R = 10k2. Simulate
Posted: Sun May 15, 2022 8:04 pm
by answerhappygod
- 5 Experiment 2 Half Wave Rectifier S1 Consider The Half Wave Rectifier Circuit In Figure 3 A With R 10k2 Simulate 1 (92.08 KiB) Viewed 53 times
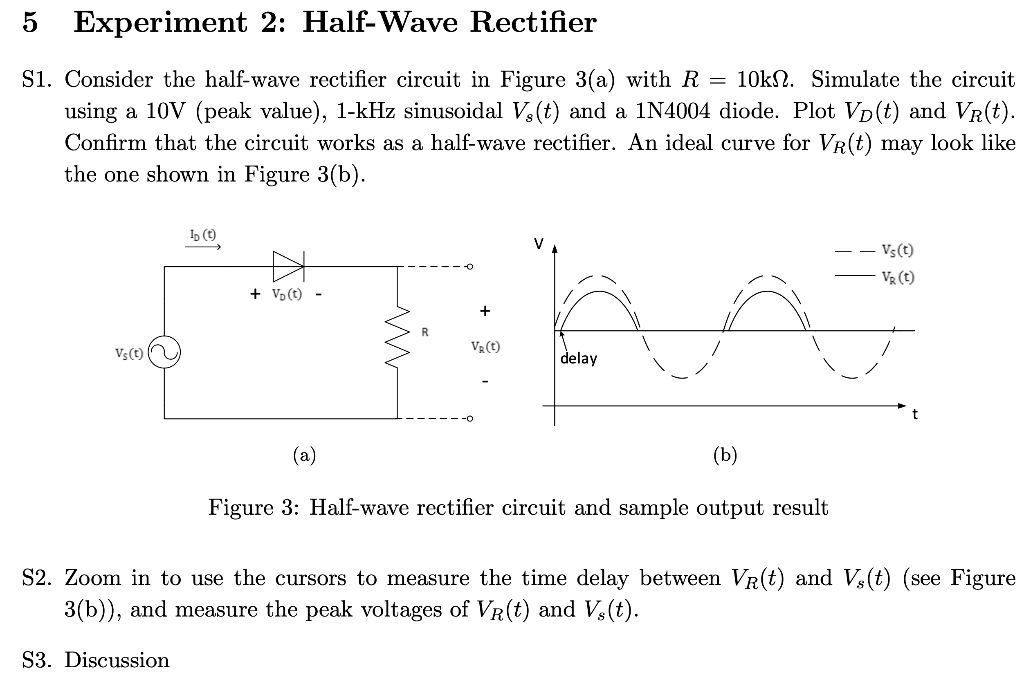
5 Experiment 2: Half-Wave Rectifier S1. Consider the half-wave rectifier circuit in Figure 3(a) with R = 10k2. Simulate the circuit using a 10V (peak value), 1-kHz sinusoidal Vs(t) and a 1N4004 diode. Plot Vo(t) and Vr(t). Confirm that the circuit works as a half-wave rectifier. An ideal curve for Vr(t) may look like the one shown in Figure 3(b). 1 (t) - Vs(t) VR (t) + V (1) + Vst) Vat) delay t (a) (b) Figure 3: Half-wave rectifier circuit and sample output result S2. Zoom in to use the cursors to measure the time delay between Vr(t) and Vs(t) (see Figure 3(b)), and measure the peak voltages of Vr(t) and Vs(t). S3. Discussion