Page 1 of 1
Question 2 Figure Q2 shows the block diagram of an engineering control system. R(s) + 18 C(s) 55 + 54 – 753 – 752 – 18s
Posted: Sun May 15, 2022 7:24 pm
by answerhappygod
- Question 2 Figure Q2 Shows The Block Diagram Of An Engineering Control System R S 18 C S 55 54 753 752 18s 1 (213.41 KiB) Viewed 49 times
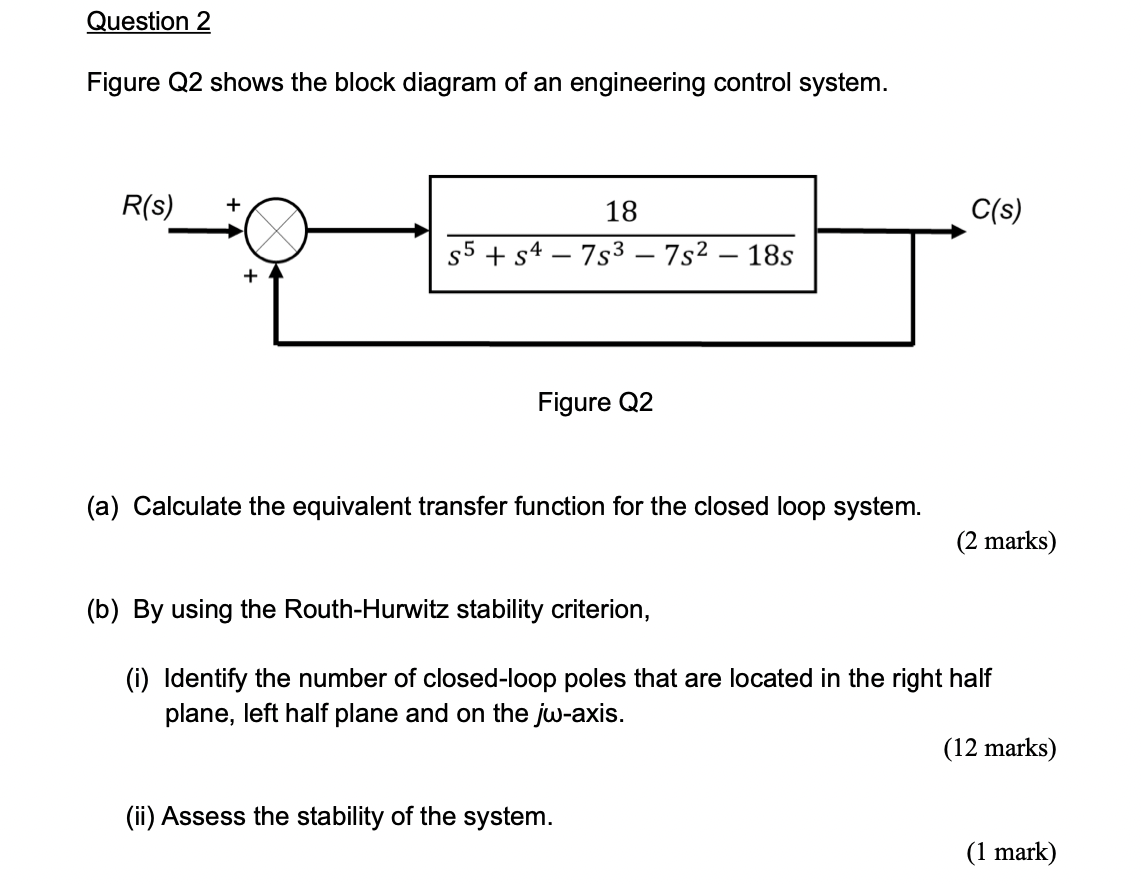
Question 2 Figure Q2 shows the block diagram of an engineering control system. R(s) + 18 C(s) 55 + 54 – 753 – 752 – 18s + Figure Q2 (a) Calculate the equivalent transfer function for the closed loop system. (2 marks) (b) By using the Routh-Hurwitz stability criterion, (i) Identify the number of closed-loop poles that are located in the right half plane, left half plane and on the jw-axis. (12 marks) (ii) Assess the stability of the system. (1 mark)