Page 1 of 1
The x-bar and s chart was used to monitor process. Twenty samples were collected each of sample size = 9. The standard v
Posted: Sun Sep 05, 2021 6:32 am
by answerhappygod
- The X Bar And S Chart Was Used To Monitor Process Twenty Samples Were Collected Each Of Sample Size 9 The Standard V 1 (48.56 KiB) Viewed 178 times
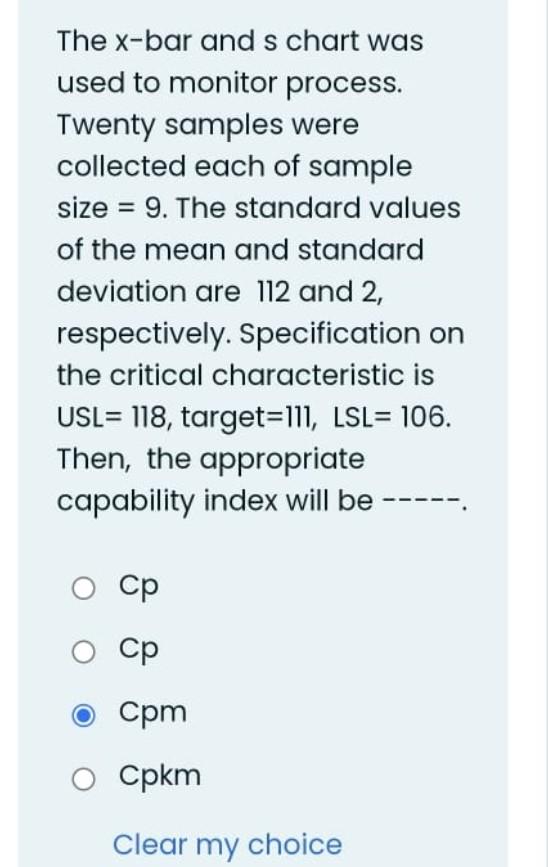
The x-bar and s chart was used to monitor process. Twenty samples were collected each of sample size = 9. The standard values of the mean and standard deviation are 112 and 2, respectively. Specification on the critical characteristic is USL= 118, target=111, LSL= 106. Then, the appropriate capability index will be Ср ОСр O Cpm Cpkm Clear my choice