Page 1 of 1
A process is being controlled with a fraction nonconforming control chart. The process average has been shown to be 0.1.
Posted: Sun Sep 05, 2021 6:32 am
by answerhappygod
- A Process Is Being Controlled With A Fraction Nonconforming Control Chart The Process Average Has Been Shown To Be 0 1 1 (36.08 KiB) Viewed 169 times
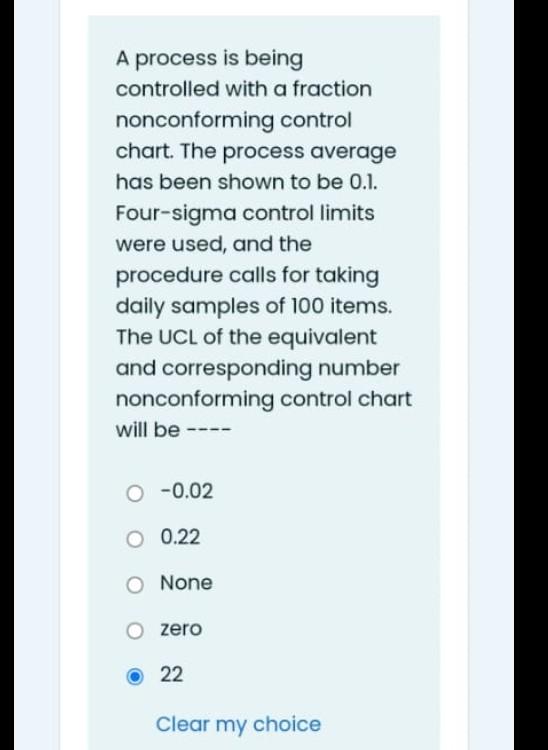
A process is being controlled with a fraction nonconforming control chart. The process average has been shown to be 0.1. Four-sigma control limits were used, and the procedure calls for taking daily samples of 100 items. The UCL of the equivalent and corresponding number nonconforming control chart will be --- 0 -0.02 O 0.22 None zero 22 Clear my choice