Page 1 of 1
The x-bar and S charts (standard values are known) are used to monitor weight (Specifications 100+9). Twenty samples wer
Posted: Sun Sep 05, 2021 6:32 am
by answerhappygod
- The X Bar And S Charts Standard Values Are Known Are Used To Monitor Weight Specifications 100 9 Twenty Samples Wer 1 (39.27 KiB) Viewed 163 times
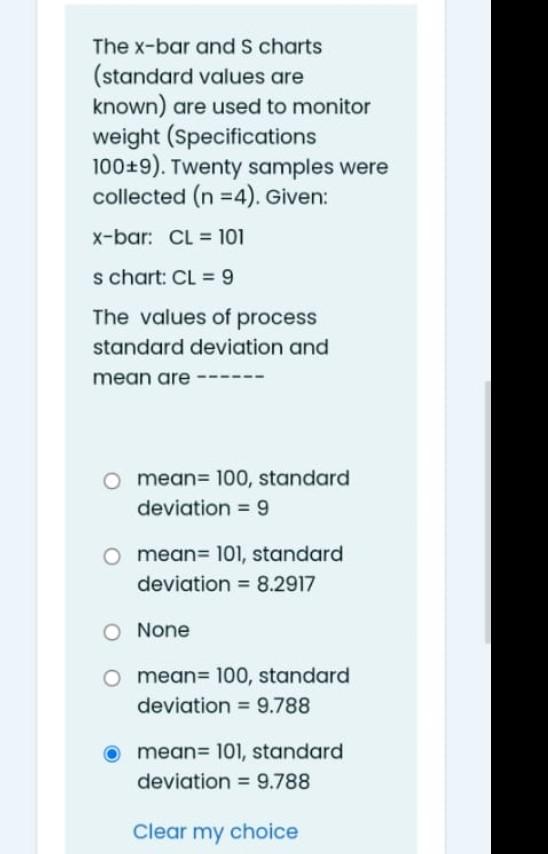
The x-bar and S charts (standard values are known) are used to monitor weight (Specifications 100+9). Twenty samples were collected (n=4). Given: X-bar: CL = 101 s chart: CL = 9 The values of process standard deviation and mean are O mean= 100, standard deviation = 9 O mean= 101, standard deviation = 8.2917 0 None O mean= 100, standard deviation = 9.788 mean= 101, standard deviation = 9.788 Clear my choice