Page 1 of 1
Using Matlab, plot the deposition rate (on a log scale) versus 1/T (Kelvin) for 600 - 1200°C for a CVD system with the f
Posted: Sun May 15, 2022 5:23 pm
by answerhappygod
- Using Matlab Plot The Deposition Rate On A Log Scale Versus 1 T Kelvin For 600 1200 C For A Cvd System With The F 1 (33.13 KiB) Viewed 58 times
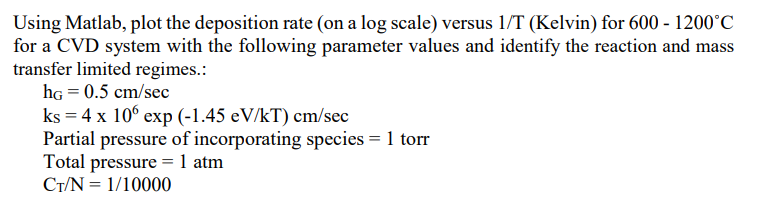
Using Matlab, plot the deposition rate (on a log scale) versus 1/T (Kelvin) for 600 - 1200°C for a CVD system with the following parameter values and identify the reaction and mass transfer limited regimes.: hg = 0.5 cm/sec ks = 4 x 100 exp (-1.45 eV/kT) cm/sec Partial pressure of incorporating species = 1 torr Total pressure = 1 atm C/N = 1/10000 =