Page 1 of 1
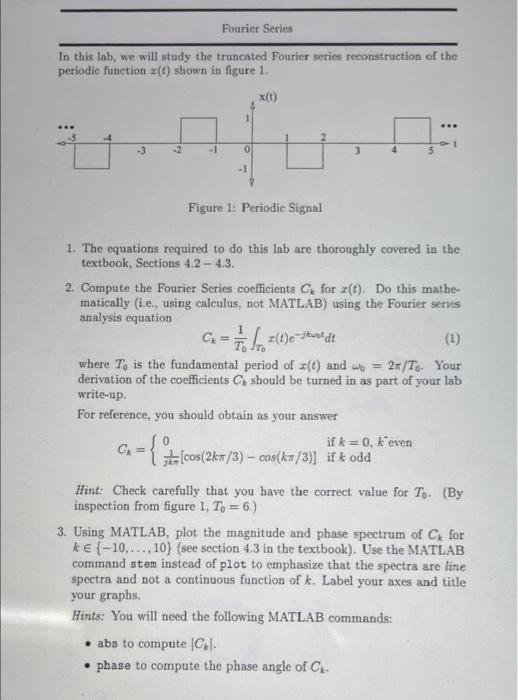
Fourier Series In this lab, we will study the truncated Fourier series reconstruction of the periodic function () shown
Posted: Sun May 15, 2022 4:38 pm
by answerhappygod
- Fourier Series In This Lab We Will Study The Truncated Fourier Series Reconstruction Of The Periodic Function Shown 1 (44.56 KiB) Viewed 56 times
Fourier Series In this lab, we will study the truncated Fourier series reconstruction of the periodic function () shown in figure 1. x(t) -4 -3 -2 - 1 0 3 4 5 - 1 Figure 1: Periodie Signal 1. The equations required to do this lab are thoroughly covered in the textbook, Sections 4.2 - 4.3. 2. Compute the Fourier Series coefficients for z(t). Do this mathe- matically i.e., using calculus, not MATLAB) using the Fourier series analysis equation CHE (1) where To is the fundamental period of z{l) and wo = 24/To Your derivation of the coefficients should be turned in as part of your lab write-up. For reference, you should obtain as your answer if k=0, k'even C - To ztte-sant dit 0 = { 1.100(2kr/3) cos(k=/3)] if korda Hint: Check carefully that you have the correct value for T. (By inspection from figure 1. To = 6.) 3. Using MATLAB, plot the magnitude and phase spectrum of for ke{-10,..., 10) (see section 4.3 in the textbook). Use the MATLAB command stem instead of plot to emphasize that the spectra are line spectra and not a continuous function of k. Label your axes and title your graphs. Hints: You will need the following MATLAB commands: • abs to compute CAl • phase to compute the phase angle of C.