Page 1 of 1
(b) Figure 2 shows the average normalized power spectral density (distribution of power) for a series of rectangular pul
Posted: Sun May 15, 2022 3:31 pm
by answerhappygod
- B Figure 2 Shows The Average Normalized Power Spectral Density Distribution Of Power For A Series Of Rectangular Pul 1 (58.97 KiB) Viewed 45 times
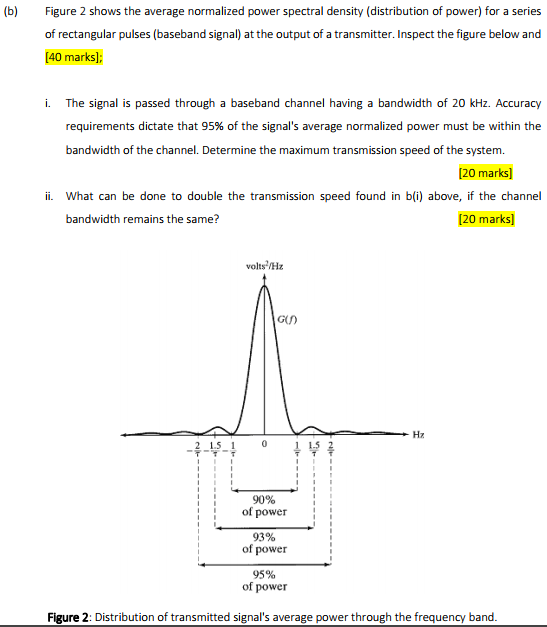
(b) Figure 2 shows the average normalized power spectral density (distribution of power) for a series of rectangular pulses (baseband signal) at the output of a transmitter. Inspect the figure below and [40 marks]; a i. The signal is passed through a baseband channel having a bandwidth of 20 kHz. Accuracy requirements dictate that 95% of the signal's average normalized power must be within the bandwidth of the channel. Determine the maximum transmission speed of the system. [20 marks] ii. What can be done to double the transmission speed found in b(i) above, if the channel bandwidth remains the same? [20 marks] volt/Hz GO HZ 0 - 1 90% of power 93% of power 95% of power Figure 2: Distribution of transmitted signal's average power through the frequency band.