Page 1 of 1
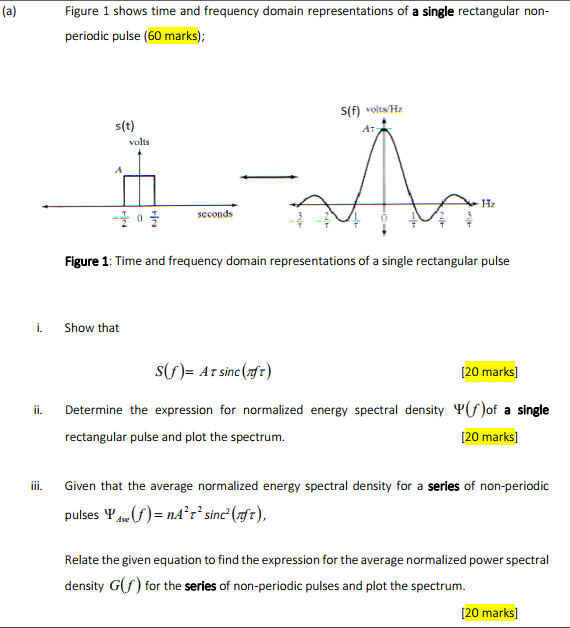
(a) Figure 1 shows time and frequency domain representations of a single rectangular non- periodic pulse (60 marks); s(f
Posted: Sun May 15, 2022 3:29 pm
by answerhappygod
- A Figure 1 Shows Time And Frequency Domain Representations Of A Single Rectangular Non Periodic Pulse 60 Marks S F 1 (57.83 KiB) Viewed 46 times
(a) Figure 1 shows time and frequency domain representations of a single rectangular non- periodic pulse (60 marks); s(f) volts HZ s(t) volts - A Hz ܙ | seconds Figure 1: Time and frequency domain representations of a single rectangular pulse i. Show that ii. s(t)= At sinc (neft) [20 marks] Determine the expression for normalized energy spectral density ( )of a single rectangular pulse and plot the spectrum. [20 marks] iii. Given that the average normalized energy spectral density for a series of non-periodic pulses Y e (f)= naʼrsinc? (ft), Relate the given equation to find the expression for the average normalized power spectral density G(f) for the series of non-periodic pulses and plot the spectrum. [20 marks)