Page 1 of 1
Given a system that has a generation portfolio shown in Table 1 and a load duration curve shown in Figure 1 for a year's
Posted: Sun May 15, 2022 3:27 pm
by answerhappygod
- Given A System That Has A Generation Portfolio Shown In Table 1 And A Load Duration Curve Shown In Figure 1 For A Year S 1 (48.99 KiB) Viewed 55 times

- Given A System That Has A Generation Portfolio Shown In Table 1 And A Load Duration Curve Shown In Figure 1 For A Year S 2 (48.99 KiB) Viewed 55 times
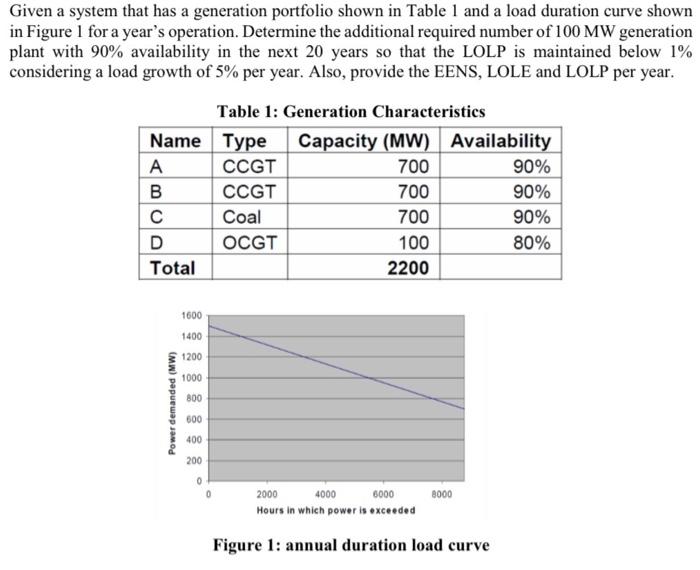
Given a system that has a generation portfolio shown in Table 1 and a load duration curve shown in Figure 1 for a year's operation. Determine the additional required number of 100 MW generation plant with 90% availability in the next 20 years so that the LOLP is maintained below 1% considering a load growth of 5% per year. Also, provide the EENS, LOLE and LOLP per year. Table 1: Generation Characteristics Name Type Capacity (MW) Availability А CCGT 700 90% B CCGT 700 90% с Coal 700 90% D OCGT 100 80% Total 2200 1600 1400 1200 1000 800 Power demanded (MW) 600 400 200 0 8000 2000 4000 6000 Hours in which power is exceeded Figure 1: annual duration load curve