Page 1 of 1
An article includes the accompanying data on compression strength (lb) for a sample of 12-oz aluminum cans filled with s
Posted: Mon Nov 15, 2021 12:25 pm
by answerhappygod
- An Article Includes The Accompanying Data On Compression Strength Lb For A Sample Of 12 Oz Aluminum Cans Filled With S 1 (100.55 KiB) Viewed 120 times
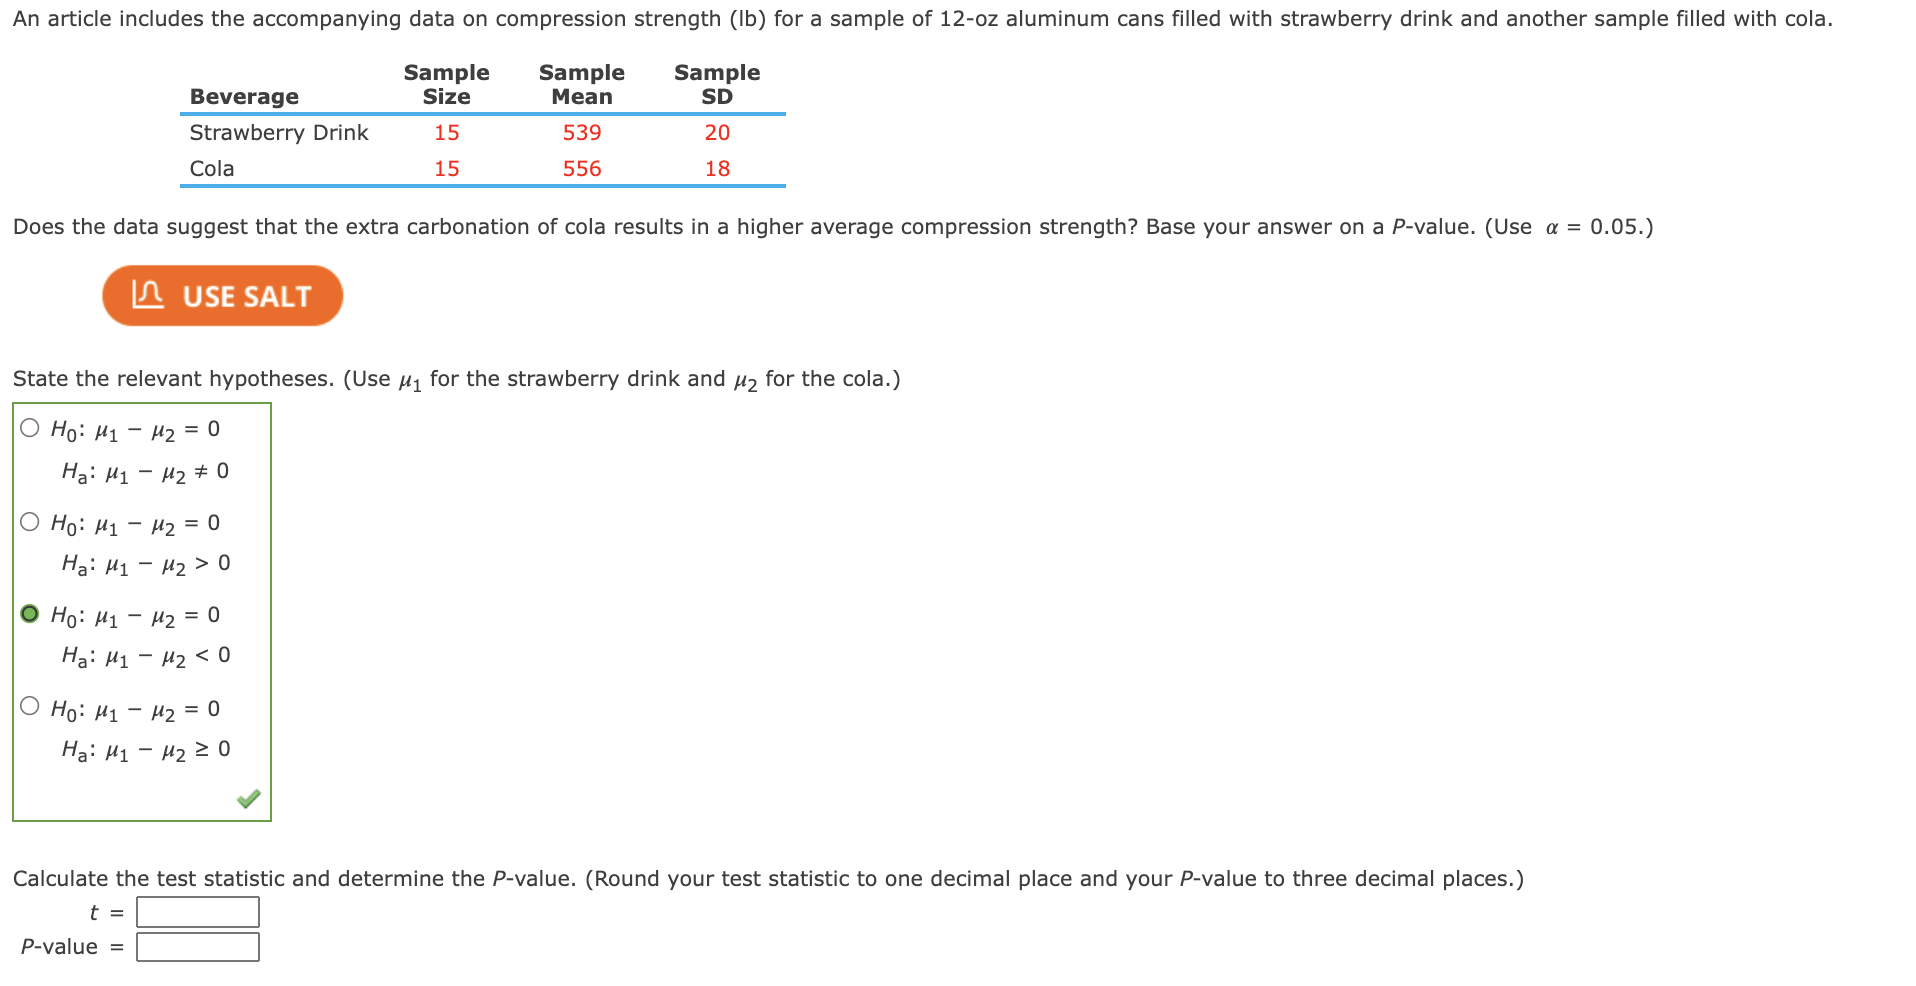
An article includes the accompanying data on compression strength (lb) for a sample of 12-oz aluminum cans filled with strawberry drink and another sample filled with cola. Sample Size Sample Mean Sample SD Beverage Strawberry Drink Cola 15 539 20 15 556 18 Does the data suggest that the extra carbonation of cola results in a higher average compression strength? Base your answer on a P-value. (Use a = 0.05.) in USE SALT State the relevant hypotheses. (Use My for the strawberry drink and up for the cola.) O Ho: M1 – M2 = 0 Ha: M1 – M2 0 O Ho: 41 – 42 = 0 Ha: H1 - H2 > 0 Ho: M1 – 12 = 0 Ha: M1 – M2 < 0 O Ho: M1 - M2 = 0 Ha: M1 - M220 Calculate the test statistic and determine the P-value. (Round your test statistic to one decimal place and your P-value to three decimal places.) t = P-value =