- X 2 The Probability Distribution Shown Here Describes A Population Of Measurements That Can Assume Values Of 1 2 3 An 1 (38.63 KiB) Viewed 113 times
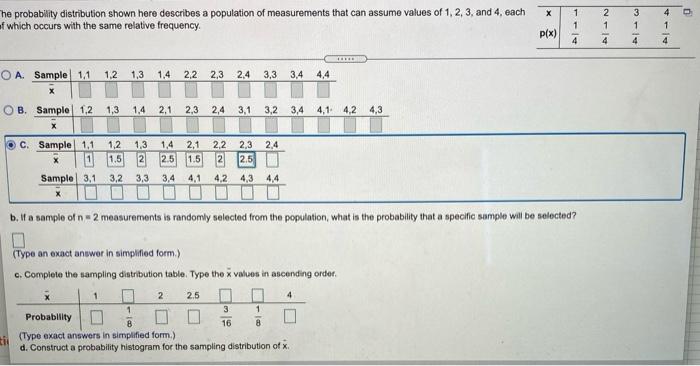
X 2 The probability distribution shown here describes a population of measurements that can assume values of 1, 2, 3, and 4, each f which occurs with the same relative frequency 1 1 NN 3 1 4 4 1 4 P(x) 4 4 #BRE O A. Sample 11 1.2 1,3 1,4 2.2 2,3 2,4 3,3 3,4 4,4 OB. Sample 1,2 1,3 1.4 2,1 2,3 2,4 3,1 3,2 3,4 4,1 4,2 4,3 IX C. Sample 1.1 1,2 1.3 1,4 2,1 2,2 2,3 2,4 1,6 2 25 1.5 2 2.5 3,2 3,3 3,4 4,1 4,2 4,3 4,4 Sample 3.1 b. If a sample of n2 measurements is randomly selected from the population, what is the probability that a specific sample will be selected? (Type an exact answer in simplified form.) c. Complete the sampling distribution table. Type the values in ascending order 4 2 2.5 3 1 Probability 8 16 8 (Type exact answers in simplified form.) d. Construct a probability histogram for the sampling distribution of til