Page 1 of 1
1 Table of critical f-distribution values Table of critical f-distribution values AREA IN THE RIGHT TAIL OF DISTRIBUTION
Posted: Mon Nov 15, 2021 11:12 am
by answerhappygod
- 1 Table Of Critical F Distribution Values Table Of Critical F Distribution Values Area In The Right Tail Of Distribution 1 (90.79 KiB) Viewed 94 times
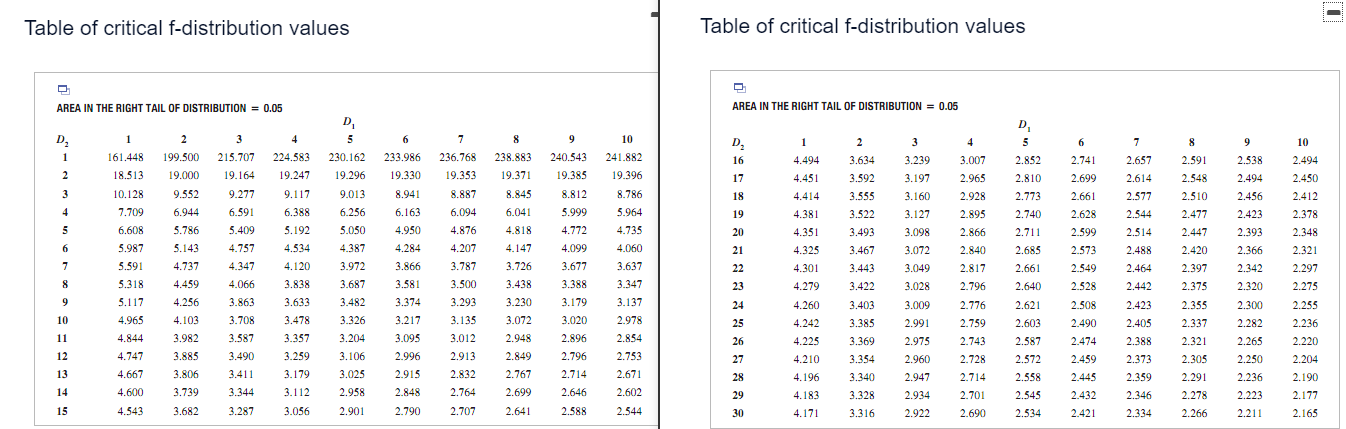
1 Table of critical f-distribution values Table of critical f-distribution values AREA IN THE RIGHT TAIL OF DISTRIBUTION = 0.05 AREA IN THE RIGHT TAIL OF DISTRIBUTION = 0.05 4 7 9 1 2 4 D. 8 D, 1 1 2 2 199.500 19.000 D 5 230.162 19.296 3 3 215.707 19.164 6 233.986 8 238.883 10 241.882 224.583 D 5 2.852 2.810 6 2.741 7 7 2.657 9 2.538 236.768 16 3.007 2.591 240.543 19.385 4.494 4.451 3 3.239 3.197 3.160 19.247 10 2.494 2.450 2.412 19.330 19.353 19.371 1 161.448 18.513 10.128 7.709 6.608 19.396 3.634 3.592 3.555 3.522 17 9.552 9.013 2.548 2.510 8.941 8.845 8.812 18 2.773 3 4 5 5 9.277 6.591 5.409 9.117 6.388 8.887 6.094 8.786 5.964 2.699 2.661 2.628 4.414 4.381 2.614 2.577 2.544 2.494 2.456 2.423 6.944 6.041 6.256 5.050 6.163 4.950 19 20 5.786 5.192 4.876 4.735 4.351 4.325 2.599 2.573 2.514 2.488 6 2.477 2.447 2.420 5.987 5.591 4.818 4.147 3.726 2.393 2.366 5.143 4.737 4.534 4.120 4.387 3.972 4.284 3.866 4.207 3.787 5.999 4.772 4.099 3.677 3.388 3.179 2.965 2.928 2.895 2.866 2.840 2.817 2.796 2.776 2.759 4.757 4.347 4.066 3.863 21 22 2.740 2.711 2.685 2.661 2.640 4.060 3.637 3.347 3.493 3.467 3.443 3.422 7 3.127 3.098 3.072 3.049 3.028 3.009 2.991 2.975 2.378 2.348 2.321 2.297 2.275 4.301 4.279 2.549 2.528 2.464 2.442 2.397 2.375 8 23 5.318 5.117 4.459 4.256 4.103 3.838 3.633 3.581 3.374 3.500 3.293 3.438 3.230 9 24 2.508 4.260 4.242 2.621 2.603 10 2.423 2.405 25 2.342 2.320 2.300 2.282 2.265 4.965 4.844 4.747 3.708 3.587 3.687 3.482 3.326 3.204 3.106 3.025 3.217 3.095 3.135 3.012 3.072 2.948 3.137 2.978 2.854 2.753 3.403 3.385 3.369 3.354 2.355 2.337 2.321 2.305 2.255 2.236 2.220 11 3.982 3.020 2.896 2.796 2.714 26 2.587 2.743 2.728 12 3.885 2.388 2.373 3.478 3.357 3.259 3.179 3.112 3.056 2.572 3.490 3.411 2.250 4.225 4.210 4.196 2.913 2.832 2.849 2.767 27 28 4.667 2.204 2.190 13 3.806 2.490 2.474 2.459 2.445 2.432 2.421 2.671 2.996 2.915 2.848 2.790 2.291 2.960 2.947 2.934 2.922 14 3.344 2.699 2.602 29 4.183 4.600 4.543 3.739 3.682 2.958 2.901 2.764 2.707 3.340 3.328 3.316 2.646 2.588 2.714 2.701 2.690 2.558 2.545 2.534 2.359 2.346 2.334 2.278 2.266 2.236 2.223 2.211 2.177 2.165 15 3.287 2.641 2.544 30 4.171
Li Partial ANOVA display F 5.0 Source Between Block Error Total Sum of Degrees of Mean sum of squares freedom squares 40 144 36.0 8 216 14
O A. Do not reject Ho. There is not a significant difference between the means. OB. Reject Ho. There is a significant difference between the means OC. Do not reject Ho. There is a significant difference between the means. OD. Reject Ho. There is not a significant difference between the means. d) Was the blocking effective? Why or why not? What are the correct null and alternative hypotheses? O A. Ho: All the PBL's are equal Hy: Not all the PBL's are equal OC. Ho: Not all the PBL's are equal Hy: All the PBL's are equal O B. Ho: All the PBL's are equal Hy: All the PBL's are different OD. Ho: All the PBL's are different H: All the PBL's are equal What is the test statistic? FBL=(Type an integer or decimal rounded to two decimal places as needed.) What is the critical value? FQ=(Type an integer or decimal rounded to two decimal places as needed.) What correct conclusion? O A. The blocking factor was not effective because He was not rejected. O B. The blocking factor was not effective because He was rejected. O C. The blocking factor was effective because Ho was not rejected. OD. The blocking factor was effective because He was rejected.