Page 1 of 1
Question 4 < > The table below shows the number of survey subjects who have received and not received a speeding ticket
Posted: Thu May 12, 2022 12:03 pm
by answerhappygod
- Question 4 The Table Below Shows The Number Of Survey Subjects Who Have Received And Not Received A Speeding Ticket 1 (62.08 KiB) Viewed 23 times
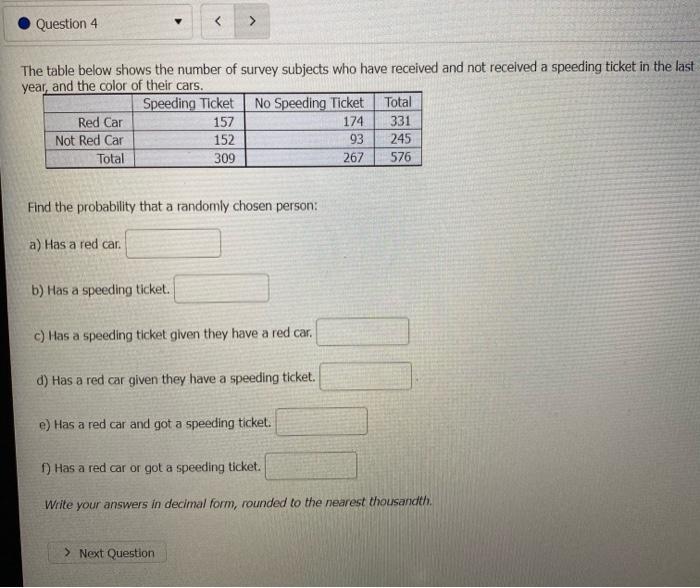
Question 4 < > The table below shows the number of survey subjects who have received and not received a speeding ticket in the last year, and the color of their cars. Speeding Ticket No Speeding Ticket Total Red Car 157 174 331 Not Red Car 152 93 245 Total 309 267 576 Find the probability that a randomly chosen person: a) Has a red car. b) Has a speeding ticket. c) Has a speeding ticket given they have a red car. d) Has a red car given they have a speeding ticket. e) Has a red car and got a speeding ticket. f) Has a red car or got a speeding ticket. Write your answers in decimal form, rounded to the nearest thousandth, > Next Question