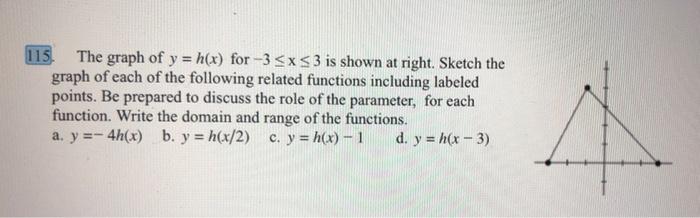
115 The graph of y = h(x) for -3
Posted: Thu May 12, 2022 9:39 am
- 115 The Graph Of Y H X For 3 X 3 Is Shown At Right Sketch The Graph Of Each Of The Following Related Functions Inc 1 (25.32 KiB) Viewed 25 times
115 The graph of y = h(x) for -3 <x<3 is shown at right. Sketch the graph of each of the following related functions including labeled points. Be prepared to discuss the role of the parameter, for each function. Write the domain and range of the functions. a. y =- 4h(x) b. y = h(x/2) c. y = h(x) - 1 d. y = h(x - 3)
Posted: Thu May 12, 2022 9:39 am
- 115 The Graph Of Y H X For 3 X 3 Is Shown At Right Sketch The Graph Of Each Of The Following Related Functions Inc 1 (25.32 KiB) Viewed 25 times