Page 1 of 1
1. Consider the function f(x,y) described by the contour diagram, where level curves $(,y) = k are plotted for different
Posted: Wed May 11, 2022 9:29 pm
by answerhappygod
- 1 Consider The Function F X Y Described By The Contour Diagram Where Level Curves Y K Are Plotted For Different 1 (67.42 KiB) Viewed 20 times
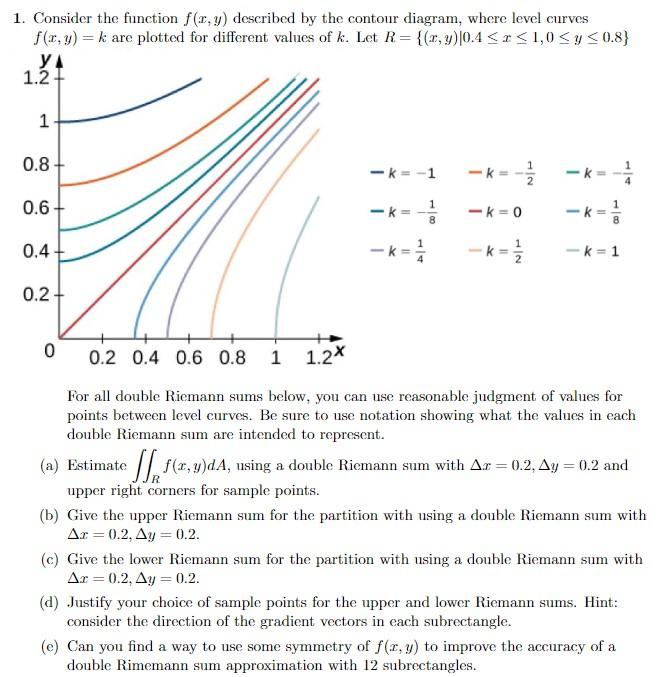
1. Consider the function f(x,y) described by the contour diagram, where level curves $(,y) = k are plotted for different values of k. Let R={(1,9)0.4 <151,0 SY50.8} YA 1.2 1 0.8 -K= -1 -K ܝܕ 를 -K- 2 0.6 -K= ܝܗ 1 8 -k=0 -K 1 0.4 -K -k= - k = 1 NI 0.2+ 0 0.2 0.4 0.6 0.8 1 1.2* For all double Riemann sums below, you can use reasonable judgment of values for points between level curves. Be sure to use notation showing what the values in each double Riemann sum are intended to represent. (a) Estimate SD, 5(8,3}d, using a double Riemann sum with Ar = 0.2, 64 = 0.2 and upper right corners for sample points. (b) Give the upper Riemann sum for the partition with using a double Riemann sum with Ar=0.2, Ay = 0.2. (c) Give the lower Riemann sum for the partition with using a double Riemann sum with Ar=0.2, Ay=0.2. (d) Justify your choice of sample points for the upper and lower Riemann sums. Hint: consider the direction of the gradient vectors in each subrectangle. (e) Can you find a way to use some symmetry of f(r,y) to improve the accuracy of a double Rimemann sum approximation with 12 subrectangles.