- Fitting A Straight Line To A Set Of Data Yields The Following Prediction Line Complete A Through C Below 13 0 1 (122.44 KiB) Viewed 24 times
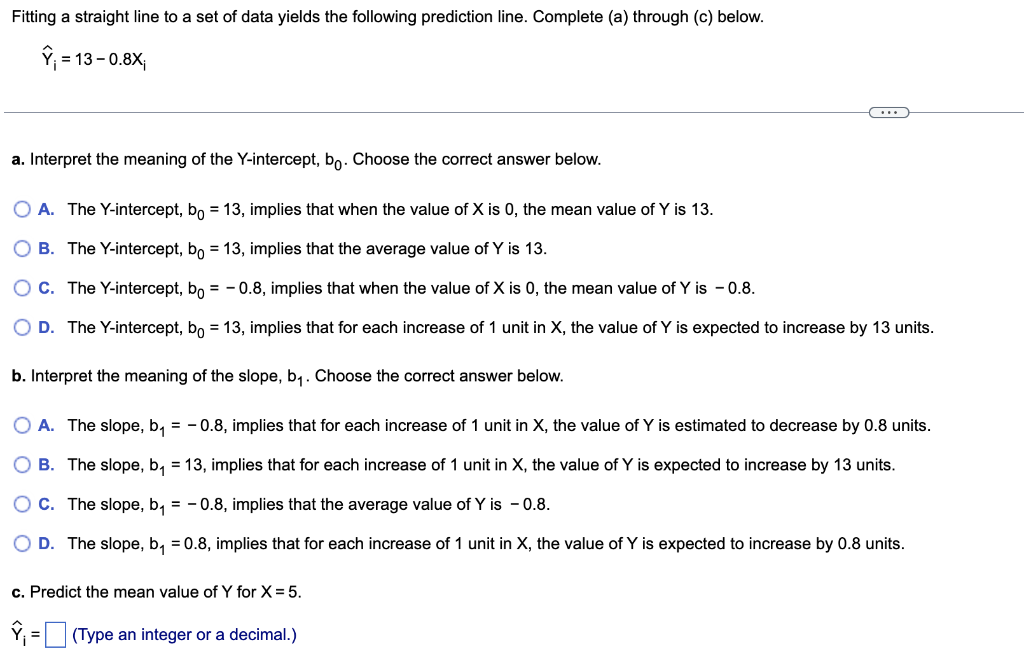
Fitting a straight line to a set of data yields the following prediction line. Complete (a) through (c) below. * = 13 -0.8X a. Interpret the meaning of the Y-intercept, bo. Choose the correct answer below. A. The Y-intercept, bo = 13, implies that when the value of X is 0, the mean value of Y is 13. B. The Y-intercept, bo = 13, implies that the average value of Y is 13. OC. The Y-intercept, bo = -0.8, implies that when the value of X is 0, the mean value of Y is -0.8. OD. The Y-intercept, bo = 13, implies that for each increase of 1 unit in X, the value of Y is expected to increase by 13 units. b. Interpret the meaning of the slope, b7. Choose the correct answer below. O A. The slope, by = -0.8, implies that for each increase of 1 unit in X, the value of Y is estimated to decrease by 0.8 units. OB. The slope, b, = 13, implies that for each increase of 1 unit in X, the value of Y is expected to increase by 13 units. O C. The slope, b = -0.8, implies that the average value of Y is - 0.8. OD. The slope, by = 0.8, implies that for each increase of 1 unit in X, the value of Y is expected to increase by 0.8 units. c. Predict the mean value of Y for X= 5. Ỹ; -(Type an integer or a decimal.)