Page 1 of 1
Crosstab racial harmony Dissatisfied or very dissatisfied Neither satisfied nor dissatisfied gender male female 63 17 13
Posted: Wed May 11, 2022 7:01 pm
by answerhappygod
- Crosstab Racial Harmony Dissatisfied Or Very Dissatisfied Neither Satisfied Nor Dissatisfied Gender Male Female 63 17 13 1 (45.7 KiB) Viewed 23 times
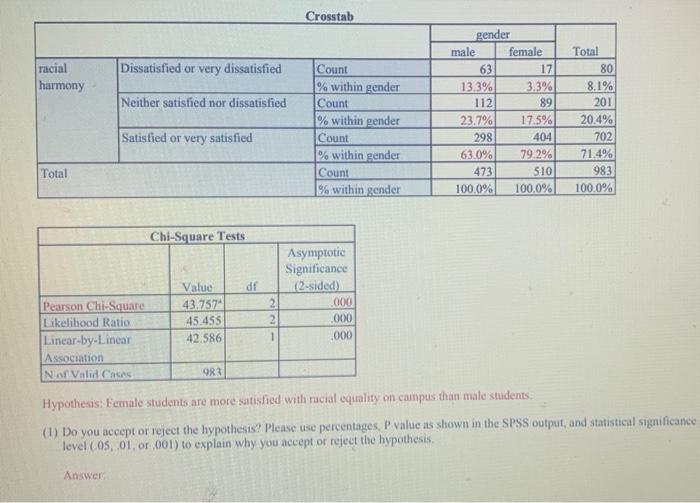
Crosstab racial harmony Dissatisfied or very dissatisfied Neither satisfied nor dissatisfied gender male female 63 17 13.3% 3.3% 112 89 23.7% 17.5% 298 404 63.0% 79.2% 473 310 100.0% 100.0% Count % within gender Count % within gender Count % within gender Count % within gender Total 80 8.1% 201 20.4% 702 71.4% 983 100.0% Satisfied or very satisfied Total Chi-Square Tests di Asymptotic Significance 12-sided) 000 .000 .000 Value 43.757 45.455 42.586 Pearson Chi-Square Likelihood Ratio Linear-by-Linear Association Nor Valid Ches 2 2 1 OR Hypothesis: Female students are more satisfied with racial equality on campus thin male students: (1) Do you accept or reject the hypothesis? Please use percentages P value as shown in the SPSS output, and statistical significance level (05.01 or 001) to explain why you accept or reject the hypothesis, Answer