Page 1 of 1
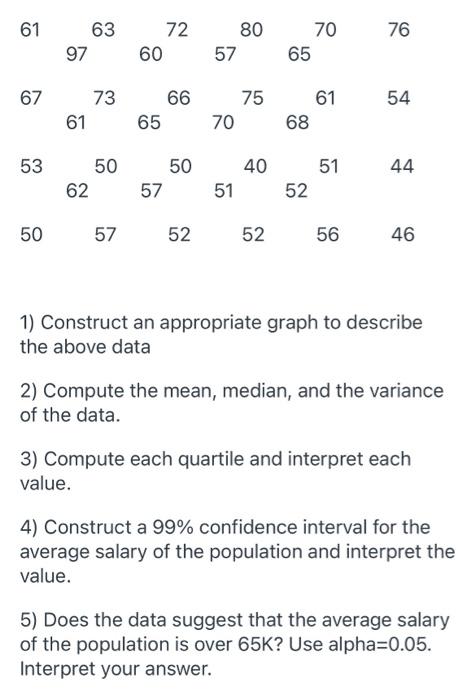
61 76 63 97 72 60 80 57 70 65 67 54 73 61 66 65 75 70 61 68 53 51 44 50 62 50 57 40 51 52 50 57 52 52 56 46 1) Construct
Posted: Wed May 11, 2022 4:29 pm
by answerhappygod
- 61 76 63 97 72 60 80 57 70 65 67 54 73 61 66 65 75 70 61 68 53 51 44 50 62 50 57 40 51 52 50 57 52 52 56 46 1 Construct 1 (40.61 KiB) Viewed 25 times
61 76 63 97 72 60 80 57 70 65 67 54 73 61 66 65 75 70 61 68 53 51 44 50 62 50 57 40 51 52 50 57 52 52 56 46 1) Construct an appropriate graph to describe the above data 2) Compute the mean, median, and the variance of the data. 3) Compute each quartile and interpret each value. 4) Construct a 99% confidence interval for the average salary of the population and interpret the value. 5) Does the data suggest that the average salary of the population is over 65K? Use alpha=0.05. Interpret your answer.