- A Statistical Program Is Recommended The Transactional Records Access Clearinghouse At Syracuse University Reported Dat 1 (152.1 KiB) Viewed 22 times
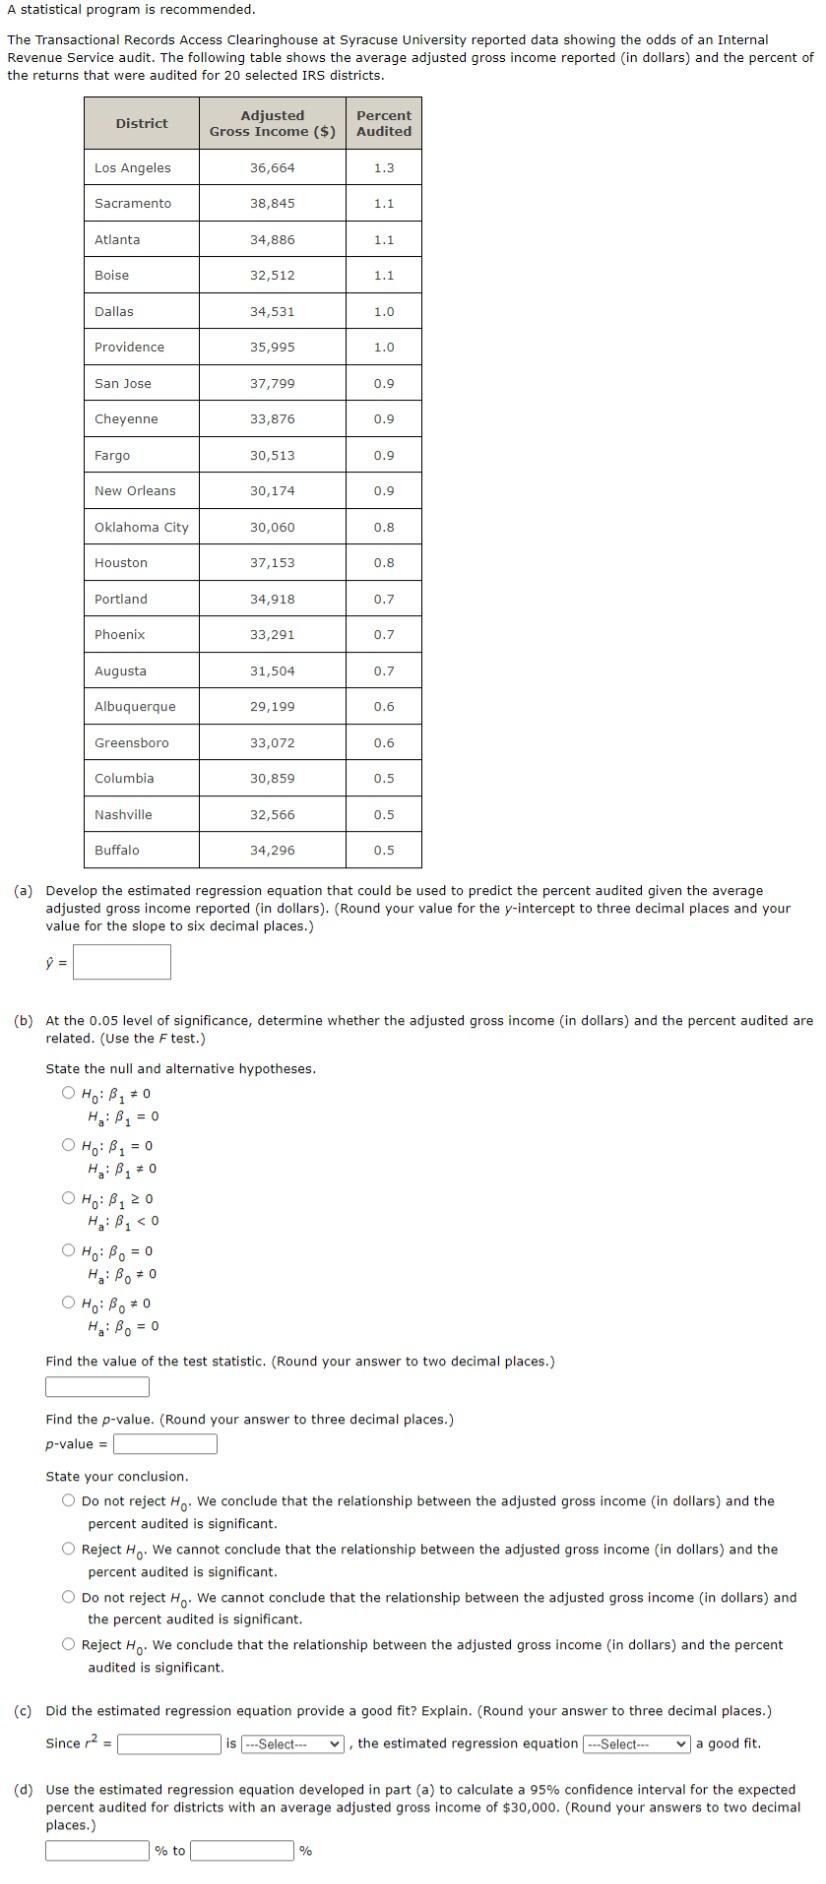
A statistical program is recommended. The Transactional Records Access Clearinghouse at Syracuse University reported data showing the odds of an Internal Revenue Service audit. The following table shows the average adjusted gross income reported (in dollars) and the percent of the returns that were audited for 20 selected IRS districts. District Adjusted Gross Income ($) Percent Audited Los Angeles 36,664 1.3 Sacramento 38,845 1.1 Atlanta 34,886 1.1 Boise 32,512 1.1 Dallas 34,531 1.0 Providence 35,995 1.0 San Jose 37,799 0.9 Cheyenne 33,876 0.9 Fargo 30,513 0.9 New Orleans 30,174 0.9 Oklahoma City 30,060 0.8 Houston 37,153 0.8 Portland 34,918 0.7 Phoenix 33,291 0.7 Augusta 31,504 0.7 Albuquerque 29,199 0.6 Greensboro 33,072 0.6 Columbia 30,859 0.5 Nashville 32,566 0.5 Buffalo 34,296 0.5 (a) Develop the estimated regression equation that could be used to predict the percent audited given the average adjusted gross income reported (in dollars). (Round your value for the y-intercept to three decimal places and your value for the slope to six decimal places.) y = (b) At the 0.05 level of significance, determine whether the adjusted gross income (in dollars) and the percent audited are related. (Use the Ftest.) State the null and alternative hypotheses. O HOBB, 0 H: B = 0 OHO: B1 = 0 Ho: B1 * 0 O Ho: B220 H₂: Bao O Ho: Bo = 0 H: Bo 0 Оно: во *о Hai Bo = 0 Find the value of the test statistic. (Round your answer to two decimal places.) Find the p-value. (Round your answer to three decimal places.) p-value = State your conclusion. O Do not reject Ho. We conclude that the relationship between the adjusted gross income (in dollars) and the percent audited is significant. Reject Ho. We cannot conclude that the relationship between the adjusted gross income in dollars) and the percent audited is significant. Do not reject Ho. We cannot conclude that the relationship between the adjusted gross income in dollars) and the percent audited is significant. Reject Ho. We conclude that the relationship between the adjusted gross income (in dollars) and the percent audited is significant. (c) Did the estimated regression equation provide a good fit? Explain. (Round your answer to three decimal places.) Since 2 is -Select- ], the estimated regression equation ---Select- a good fit. (d) Use the estimated regression equation developed in part (a) to calculate a 95% confidence interval for the expected percent audited for districts with an average adjusted gross income of $30,000. (Round your answers to two decimal places.) % to %
Adjusted Gross Income 36,664 38.845 34.886 32,512 34,531 35,995 37.799 33.876 30,513 30.174 30.060 37,153 34,918 33,291 31,504 29,199 33,072 30.859 32,566 34,296 Percent Audited 1.3 1.1 1.1 1.1 1 1 0.9 0.9 0.9 1 District 2 Los Angeles 3 Sacramento 4 Atlanta 5 Boise 6 Dallas 7 Providence 8 San Jose 9 Cheyenne 10 Fargo 11 New Orleans 12 Oklahoma City 13 Houston 14 Portland 15 Phoenix 16 Augusta 17 Albuquerque 18 Greensboro 19 Columbia 20 Nashville 21 Buffalo 0.9 0.8 0.8 0.7 0.7 0.7 0.6 0.6 0.5 0.5 0.5