- Mat 151 Statistics 1 Statistical Inference Computer Lab Activity For Unit 4 Hypothesis Testing Directions Open A W 1 (83.04 KiB) Viewed 27 times
- Mat 151 Statistics 1 Statistical Inference Computer Lab Activity For Unit 4 Hypothesis Testing Directions Open A W 2 (57.43 KiB) Viewed 27 times
- Mat 151 Statistics 1 Statistical Inference Computer Lab Activity For Unit 4 Hypothesis Testing Directions Open A W 3 (53.73 KiB) Viewed 27 times
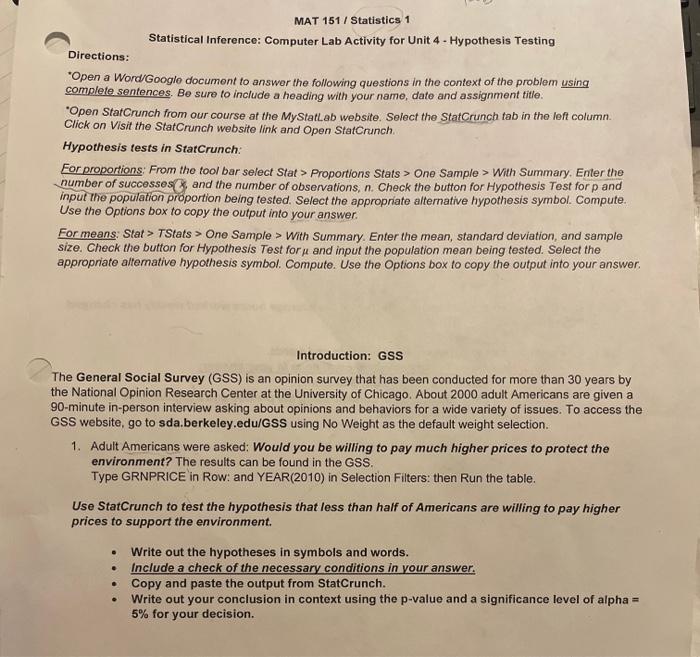
MAT 151 / Statistics 1 Statistical Inference: Computer Lab Activity for Unit 4. Hypothesis Testing Directions: "Open a Word Google document to answer the following questions in the context of the problem using complete sentences. Be sure to include a heading with your name, date and assignment title. "Open StarCrunch from our course at the MyStatLab website. Select the StatCrunch tab in the left column. Click on Visit the StatCrunch website link and Open StatCrunch Hypothesis tests in StarCrunch: For proportions: From the tool bar select Stat > Proportions Stats > One Sample > With Summary. Enter the number of successes, and the number of observations, n. Check the button for Hypothesis Test for p and input the population proportion being tested. Select the appropriate alternative hypothesis symbol. Compute. Use the options box to copy the output into your answer. For means: Stat > TStats > One Sample > With Summary. Enter the mean, standard deviation, and sample size. Check the button for Hypothesis Test for and input the population mean being tested. Select the appropriate alternative hypothesis symbol. Compute. Use the Options box to copy the output into your answer. Introduction: GSS The General Social Survey (GSS) is an opinion survey that has been conducted for more than 30 years by the National Opinion Research Center at the University of Chicago. About 2000 adult Americans are given a 90-minute in-person interview asking about opinions and behaviors for a wide variety of issues. To access the GSS website, go to sda.berkeley.edu/GSS using No Weight as the default weight selection. 1. Adult Americans were asked: Would you be willing to pay much higher prices to protect the environment? The results can be found in the GSS. Type GRNPRICE in Row: and YEAR(2010) in Selection Filters: then Run the table. Use StatCrunch to test the hypothesis that less than half of Americans are willing to pay higher prices to support the environment . . Write out the hypotheses in symbols and words. Include a check of the necessary conditions in your answer. Copy and paste the output from StatCrunch. Write out your conclusion in context using the p-value and a significance level of alpha = 5% for your decision. .
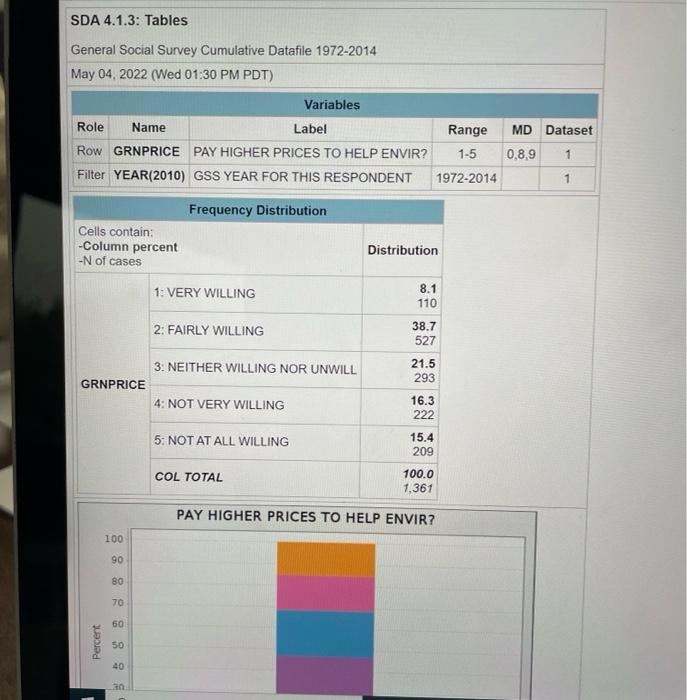
SDA 4.1.3: Tables General Social Survey Cumulative Datafile 1972-2014 May 04, 2022 (Wed 01:30 PM PDT) Variables Role Name Label Row GRNPRICE PAY HIGHER PRICES TO HELP ENVIR? Filter YEAR(2010) GSS YEAR FOR THIS RESPONDENT MD Dataset Range 1-5 1972-2014 0,8,9 1 1 Frequency Distribution Cells contain: -Column percent -N of cases Distribution 1: VERY WILLING 8.1 110 2: FAIRLY WILLING 38.7 527 3. NEITHER WILLING NOR UNWILL GRNPRICE 4: NOT VERY WILLING 21.5 293 16.3 222 5: NOT AT ALL WILLING 15.4 209 COL TOTAL 100.0 1.361 PAY HIGHER PRICES TO HELP ENVIR? 100 90 80 70 60 Percent 50 40 20
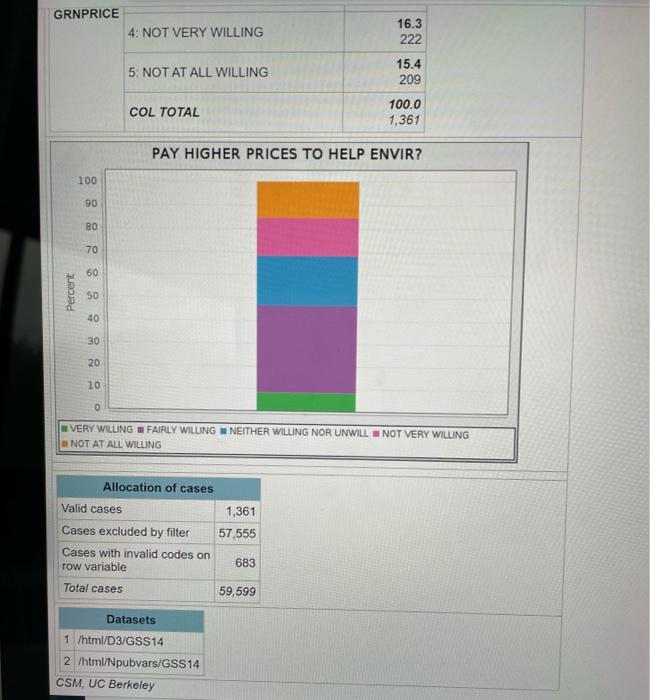
GRNPRICE 4: NOT VERY WILLING 16.3 222 5: NOT AT ALL WILLING 15.4 209 COL TOTAL 100.0 1,361 PAY HIGHER PRICES TO HELP ENVIR? 100 90 80 70 60 Percent 50 40 30 20 10 0 VERY WILLING FAIRLY WILLING NEITHER WILLING NOR UNWILL NOT VERY WILLING NOT AT ALL WILLING Allocation of cases Valid cases Cases excluded by filter Cases with invalid codes on row variable 1,361 57,555 683 Total cases 59,599 Datasets 1 /html/D3/GSS14 2 /html/Npubvars/GSS14 CSM, UC Berkeley