Page 1 of 1
The National Longitudinal Study of Adolescent Health interviewed several thousand teens (grades 7 to 12). One question a
Posted: Wed May 11, 2022 3:23 pm
by answerhappygod
- The National Longitudinal Study Of Adolescent Health Interviewed Several Thousand Teens Grades 7 To 12 One Question A 1 (39.01 KiB) Viewed 25 times
2.
- The National Longitudinal Study Of Adolescent Health Interviewed Several Thousand Teens Grades 7 To 12 One Question A 2 (39.02 KiB) Viewed 25 times
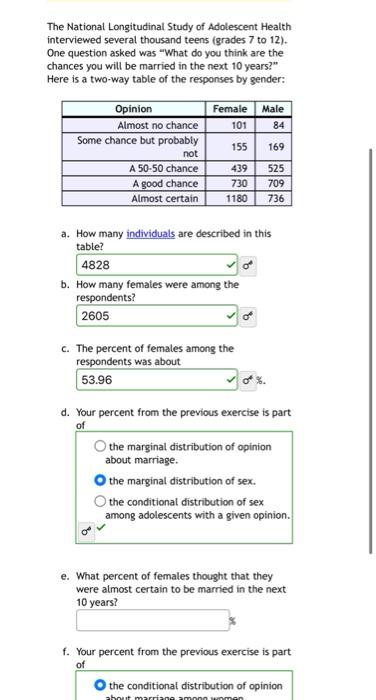
The National Longitudinal Study of Adolescent Health interviewed several thousand teens (grades 7 to 12). One question asked was "What do you think are the chances you will be married in the next 10 years?" Here is a two-way table of the responses by gender: Opinion Female Male Almost no chance 101 84 Some chance but probably 155 169 not A 50-50 chance 439 525 A good chance 730 709 Almost certain 1180 736 a. How many individuals are described in this table? 4828 b. How many females were among the respondents? 2605 C. The percent of females among the respondents was about 53.96 Of %. d. Your percent from the previous exercise is part of the marginal distribution of opinion about marriage. the marginal distribution of sex. the conditional distribution of sex among adolescents with a given opinion. e. What percent of females thought that they were almost certain to be married in the next 10 years? f. Your percent from the previous exercise is part of the conditional distribution of opinion about marriage amma
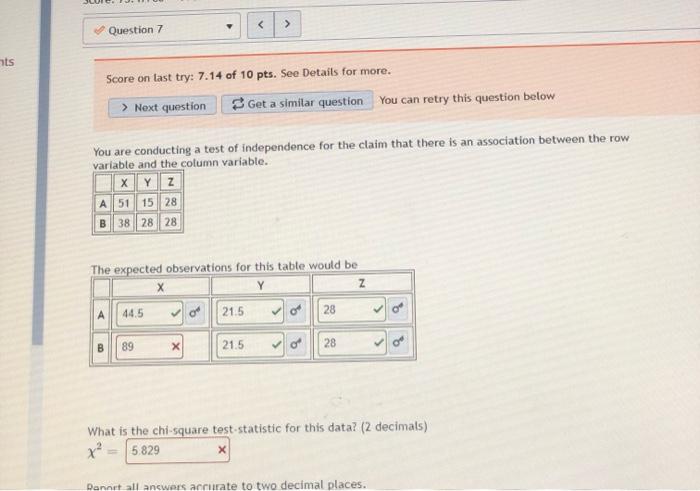
< > Question 7 ats Score on last try: 7.14 of 10 pts. See Details for more. > Next question Get a similar question You can retry this question below You are conducting a test of independence for the claim that there is an association between the row variable and the column variable. X Y Z A 51 15 28 B38 2828 The expected observations for this table would be Y N 21.5 A 44,5 COM 28 ola 89 21.5 28 % What is the chi-square test statistic for this data? (2 decimals) x? 5.829 X Denntall answers accurate to two decimal places.