Page 1 of 1
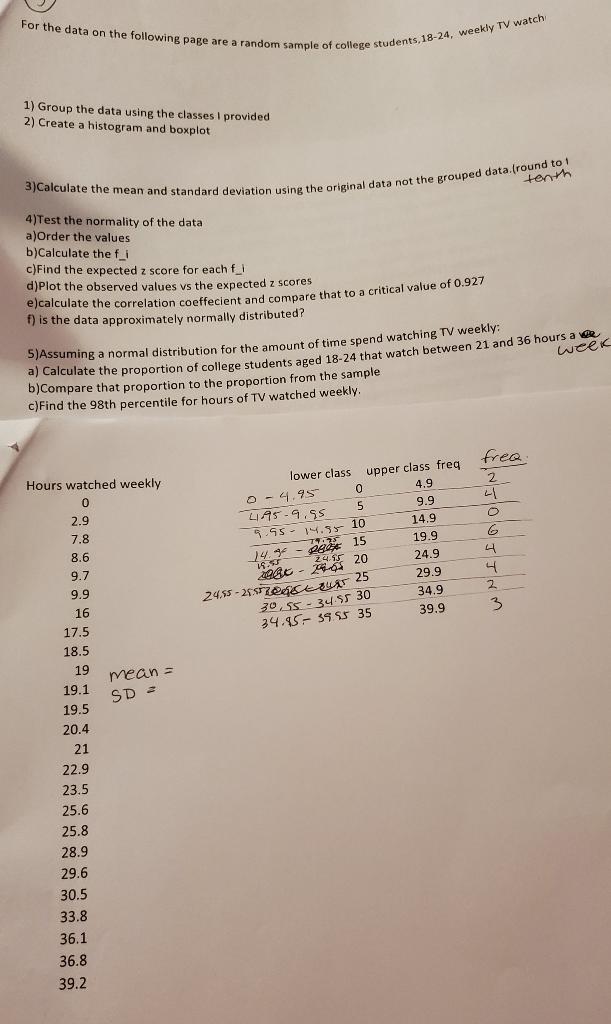
For the data on the following page are a random sample of college students, 18-24, weekly TV watch 1) Group the data usi
Posted: Wed May 11, 2022 3:02 pm
by answerhappygod
- For The Data On The Following Page Are A Random Sample Of College Students 18 24 Weekly Tv Watch 1 Group The Data Usi 1 (64.68 KiB) Viewed 30 times
For the data on the following page are a random sample of college students, 18-24, weekly TV watch 1) Group the data using the classes I provided 2) Create a histogram and boxplot tonth 3)Calculate the mean and standard deviation using the original data not the grouped data.(round to 4)Test the normality of the data a)Order the values b)Calculate the fi c) Find the expected z score for each fl d)Plot the observed values vs the expected z scores e calculate the correlation coeffecient and compare that to a critical value of 0.927 f) is the data approximately normally distributed? 5)Assuming a normal distribution for the amount of time spend watching TV weekly: a) Calculate the proportion of college students aged 18-24 that watch between 21 and 36 hours a b)Compare that proportion to the proportion from the sample c)Find the 98th percentile for hours of TV watched weekly week lower class upper class freq o-4.95 0 4.9 1959.95 5 9.9 9.55-14.58 10 14.9 19.9 14. - PE 15 . 24 15 20 24.9 29.9 2485-270azu 25 34.9 34.85- 39.55 35 39.9 frea 2 21 0 6 4 니 2. 2. dec 30.55 - 34-55 30 3 Hours watched weekly 0 2.9 7.8 8.6 9.7 9.9 16 17.5 18.5 19 19.1 19.5 20.4 21 22.9 23.5 25.6 25.8 mean = SD 2 28.9 29.6 30.5 33.8 36.1 36.8 39.2