- For Questions 1 7 Please Open The Interview Techniques Data A Researcher Is Interested In Understanding Which Intervie 1 (67.86 KiB) Viewed 28 times

- For Questions 1 7 Please Open The Interview Techniques Data A Researcher Is Interested In Understanding Which Intervie 2 (9.09 KiB) Viewed 28 times
- For Questions 1 7 Please Open The Interview Techniques Data A Researcher Is Interested In Understanding Which Intervie 3 (35.24 KiB) Viewed 28 times
For Questions 1-7, please open the Interview Techniques data. A researcher is interested in understanding which interview techniques increase the number of accurate details provided by an eyewitness about a crime. Specifically, they want to investigate the effectiveness of the Standard Police Interview (SPI), Structured Interview (Si), or Modified Cognitive Interview (MCI). Participants watched a video of a mock crime and were interviewed using one interview technique (SPI, SI, or MCI). The number of accurate, forensically relevant details were recorded. Demographic information was also collected. Part 1 - Perform and Interpret a One-Way ANOVA (8 points total) The research question: Is there a significant difference in the number of accurate details based on interview technique (MCI, SI, or SPI)? Q1. What is the null hypothesis? (1) Q2. What are the DV and IV? (1) Exit Full Screen Q3. Now, run a one-way ANOVA. Before you run the test, remember to go to Options and select "homogeneity of variance test." Was the test for homogeneity of variance significant? Do the data meet the assumption of equal variances among the groups? (1) Q4. Calculate the effect size 12 for this analysis. You can do so manually or request the effect size within SPSS. (1) 05. Report the results of the one-way ANOVA using symbols in the APA format, including the F statistic, the p value, and the effect size n?. See the APA guide for reporting statistics in "Assignment Guides." (1) Q6. What is the decision about the null hypothesis (reject or fail to reject) based on the test result? (1)
PSY514 Q7. Create a bar graph or line graph to show number of correct details for participants in each Interview technique group. (2)
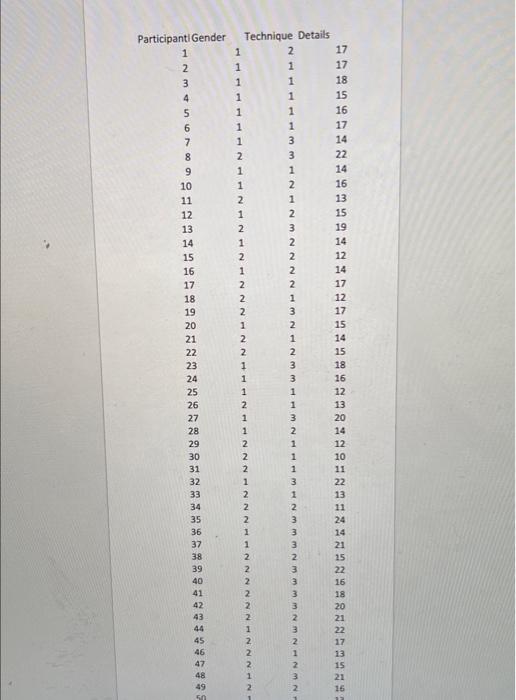
Participanti Gender 3 4 5 6 7 8 9 10 11 12 13 14 15 16 17 18 19 20 21 22 23 24 Technique Details 2 1 1 1 1 1 1 15 1 1 16 1 1 17 1 3 14 2 3 22 1 1 14 1 2 16 2 1 13 1 2 15 2 3 19 1 2 14 2 2 12 1 2 14 2 2 17 2. 1 12 2. 3 17 1 2 15 2. 1 14 2 15 1 3 18 1 3 16 1 12 2 1 13 1 3 20 1 2 2 1 SAS 1 3 1 2 3 3 1 2 2 2 1 1 2 2 30 31 32 33 34 35 36 37 38 39 40 41 42 43 44 45 46 47 48 49 22 13 11 24 14 21 2 2 2 MNMMMNMN NMN 2 2 1 2