Page 1 of 1
A company which manufactures and sells widgets is analyzing the price at which they sell the widgets. They collect data
Posted: Mon Nov 15, 2021 10:17 am
by answerhappygod
- A Company Which Manufactures And Sells Widgets Is Analyzing The Price At Which They Sell The Widgets They Collect Data 1 (51.58 KiB) Viewed 117 times
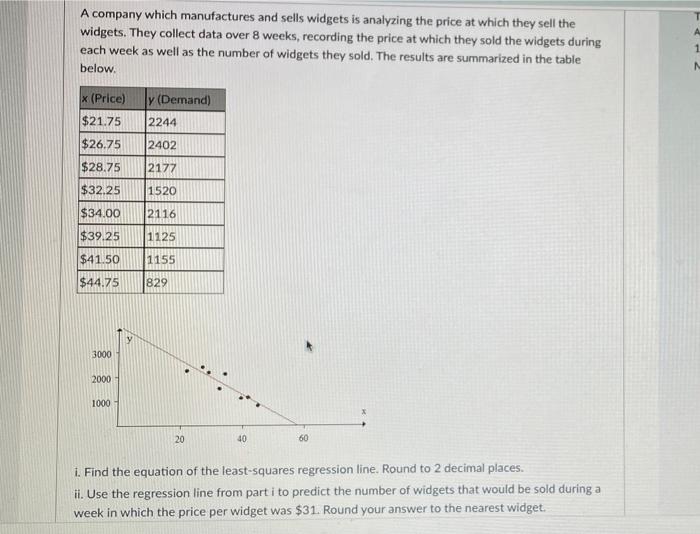
A company which manufactures and sells widgets is analyzing the price at which they sell the widgets. They collect data over 8 weeks, recording the price at which they sold the widgets during each week as well as the number of widgets they sold. The results are summarized in the table below. А 1 N x (Price) y (Demand) $21.75 2244 $26.75 2402 $28.75 2177 $32.25 1520 $34.00 2116 $39.25 1125 $41.50 1155 $44.75 829 V 3000 2000 1000 20 40 60 1. Find the equation of the least-squares regression line. Round to 2 decimal places. ii. Use the regression line from part i to predict the number of widgets that would be sold during a week in which the price per widget was $31. Round your answer to the nearest widget.