Page 1 of 1
Question 2 [22] The table below shows the number of cases of AIDS in a certain country by date of diagnosis for successi
Posted: Wed May 11, 2022 2:05 pm
by answerhappygod
- Question 2 22 The Table Below Shows The Number Of Cases Of Aids In A Certain Country By Date Of Diagnosis For Successi 1 (56.37 KiB) Viewed 28 times
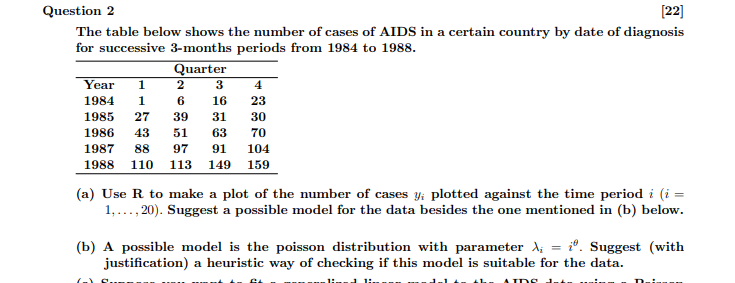
Question 2 [22] The table below shows the number of cases of AIDS in a certain country by date of diagnosis for successive 3-months periods from 1984 to 1988. Quarter Year 1 2 3 4 1984 1 6 16 23 1985 27 30 1986 43 70 1987 88 97 91 104 1988 110 113 149 159 39 51 31 63 (a) Use R to make a plot of the number of cases yi plotted against the time period i (i = 1,..., 20). Suggest a possible model for the data besides the one mentioned in (b) below. (b) A possible model is the poisson distribution with parameter li = i". Suggest (with justification) a heuristic way of checking if this model is suitable for the data.