Page 1 of 1
Suppose a z test with the following null and alternative hypotheses resulted in a z stat of -2.07. Ho : u = = 50 H: :μ<
Posted: Wed May 11, 2022 1:55 pm
by answerhappygod
- 1 (210.82 KiB) Viewed 22 times
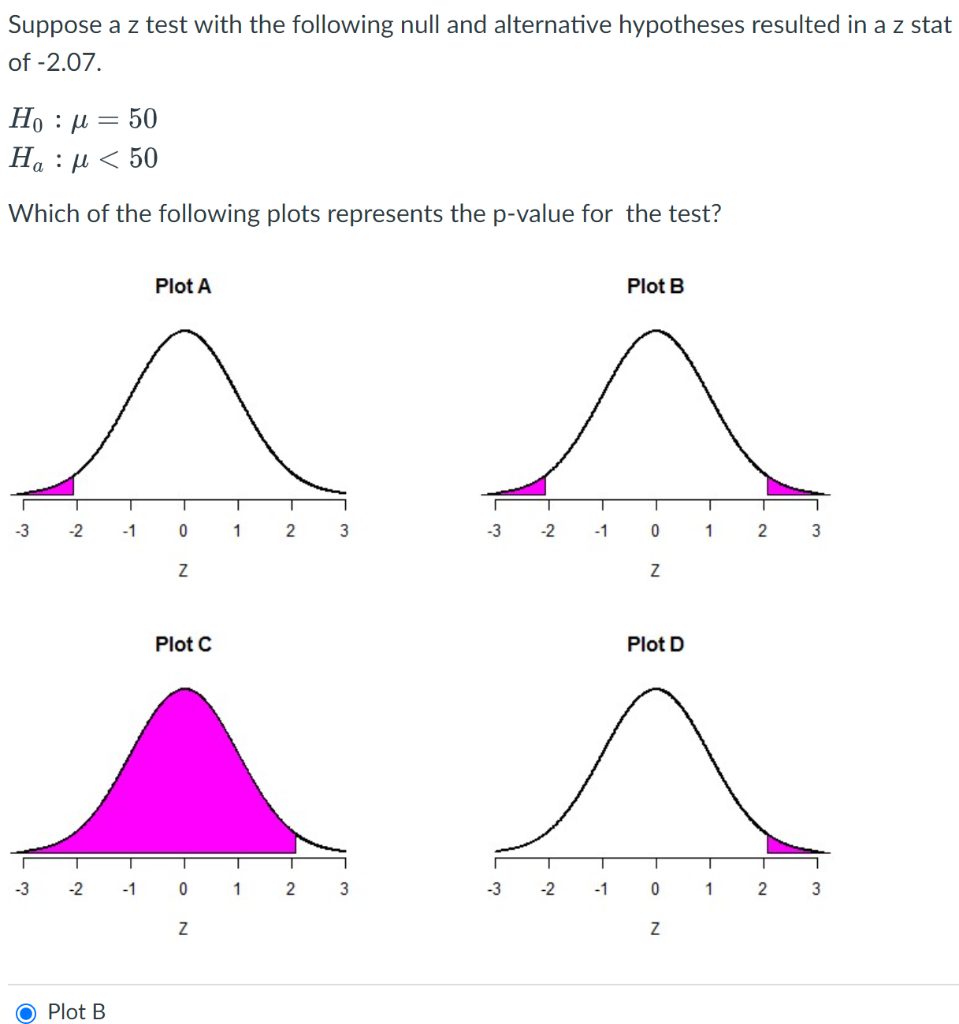
Suppose a z test with the following null and alternative hypotheses resulted in a z stat of -2.07. Ho : u = = 50 H: :μ< 50 Which of the following plots represents the p-value for the test? Plot A Plot B T 1 1 T 1 -3 -2 -1 0 1 2 3 -3 -2 -1 0 1 2 3 Z Z Plot C Plot D 1 -3 - 2 -1 0 1 2 3 -3 -2 -1 0 1 2 3 Z Z O Plot B