Page 1 of 1
Problem 5 (30 pts) A normally distributed quality characteristic is monitored through use of an x and an R chart. These
Posted: Wed May 11, 2022 1:42 pm
by answerhappygod
- Problem 5 30 Pts A Normally Distributed Quality Characteristic Is Monitored Through Use Of An X And An R Chart These 1 (41.87 KiB) Viewed 31 times
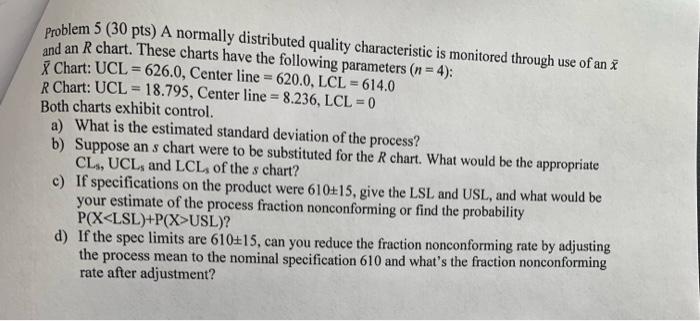
Problem 5 (30 pts) A normally distributed quality characteristic is monitored through use of an x and an R chart. These charts have the following parameters (n = 4); Chart: UCL = 626.0, Center line = 620.0, LCL = 614.0 R Chart: UCL - 18.795, Center line = 8.236, LCL = 0 Both charts exhibit control. a) What is the estimated standard deviation of the process? b) Suppose an s chart were to be substituted for the R chart. What would be the appropriate CL, UCL, and LCL of the s chart? c) If specifications on the product were 610+15, give the LSL and USL, and what would be your estimate of the process fraction nonconforming or find the probability P(X<LSL)+P(X>USL)? d) If the spec limits are 610£15, can you reduce the fraction nonconforming rate by adjusting the process mean to the nominal specification 610 and what's the fraction nonconforming rate after adjustment?