Page 1 of 1
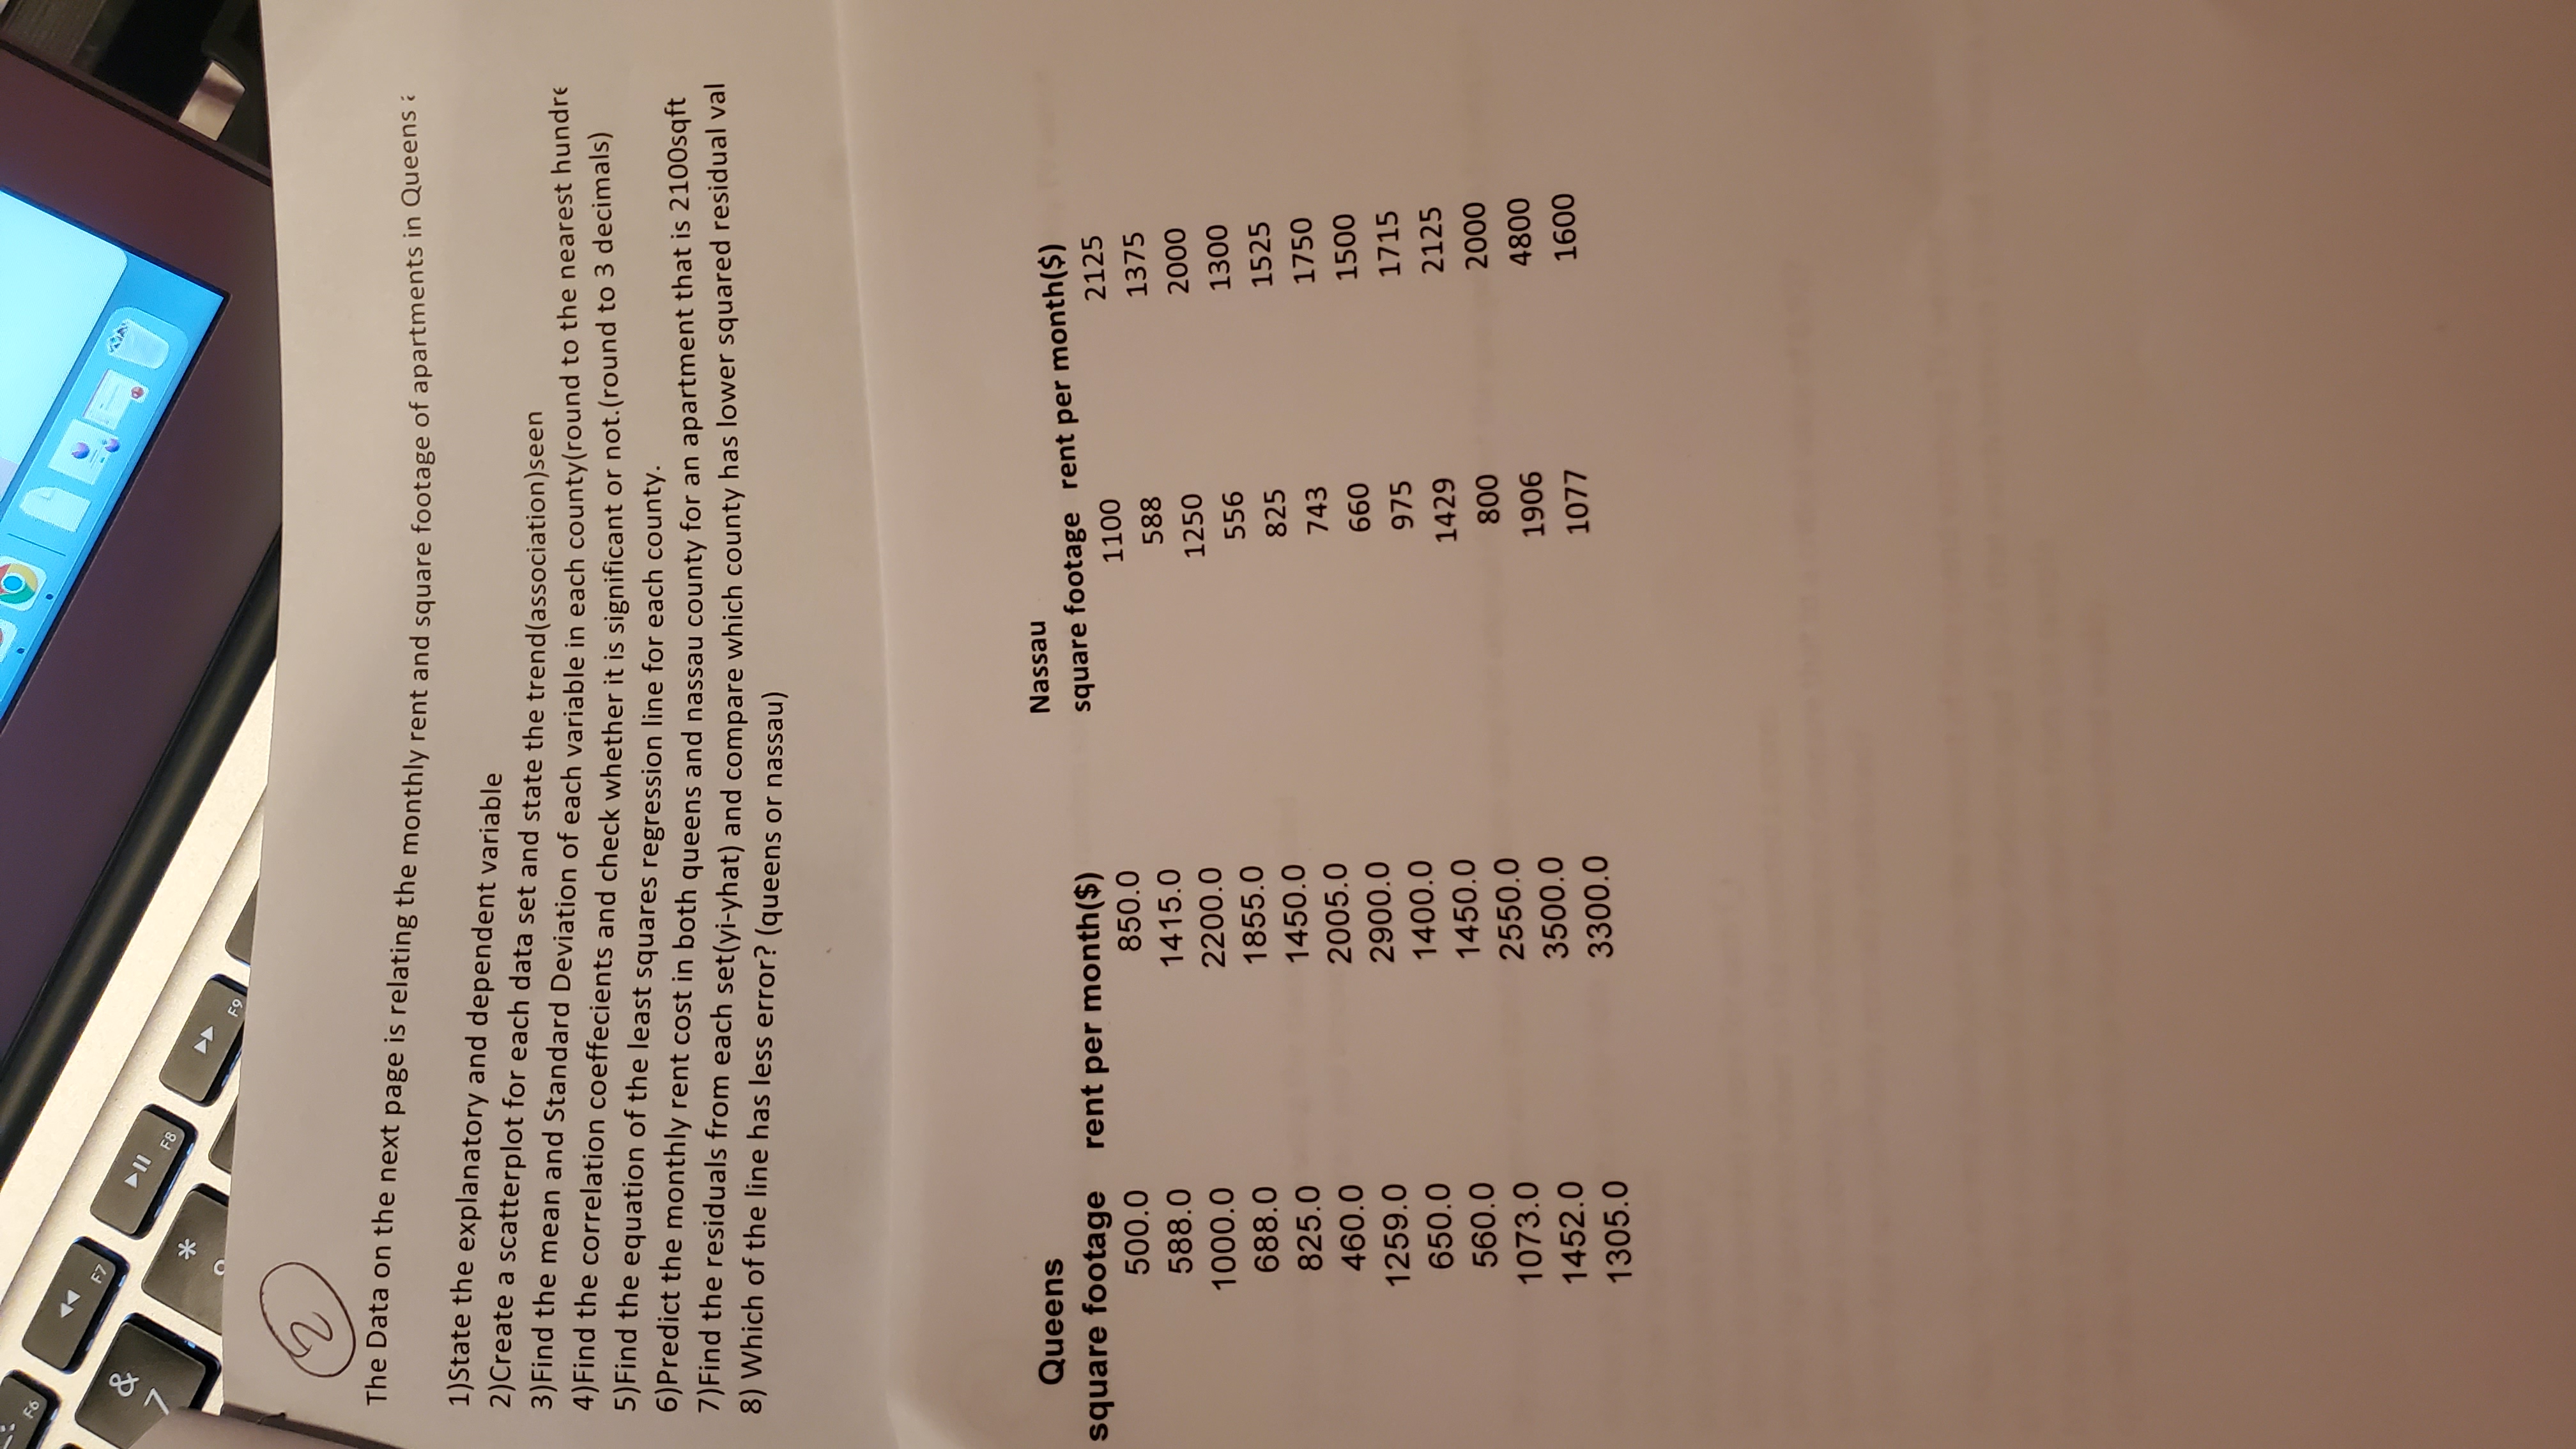
FO F7 & 11 F8 F9 2 The Data on the next page is relating the monthly rent and square footage of apartments in Queens 1)S
Posted: Wed May 11, 2022 1:39 pm
by answerhappygod
- Fo F7 11 F8 F9 2 The Data On The Next Page Is Relating The Monthly Rent And Square Footage Of Apartments In Queens 1 S 1 (1.46 MiB) Viewed 27 times
FO F7 & 11 F8 F9 2 The Data on the next page is relating the monthly rent and square footage of apartments in Queens 1)State the explanatory and dependent variable 2)Create a scatterplot for each data set and state the trend(association)seen 3) Find the mean and Standard Deviation of each variable in each county(round to the nearest hundre 4)Find the correlation coeffecients and check whether it is significant or not.(round to 3 decimals) 5)Find the equation of the least squares regression line for each county. 6)Predict the monthly rent cost in both queens and nassau county for an apartment that is 2100sqft 7)Find the residuals from each set(yi-yhat) and compare which county has lower squared residual val 8) Which of the line has less error? (queens or nassau) Queens square footage rent per month($) 500.0 850.0 588.0 1415.0 1000.0 2200.0 688.0 1855.0 825.0 1450.0 460.0 2005.0 1259.0 2900.0 650.0 1400.0 560.0 1450.0 1073.0 2550.0 1452.0 3500.0 1305.0 3300.0 Nassau square footage rent per month($) 1100 2125 588 1375 1250 2000 556 1300 825 1525 743 1750 660 1500 975 1715 1429 2125 800 2000 1906 4800 1077 1600