Page 1 of 1
The Ridge regression coefficients and the VIFs of the Body Fat example are given below. Find the best biasing constant a
Posted: Wed May 11, 2022 1:38 pm
by answerhappygod
- The Ridge Regression Coefficients And The Vifs Of The Body Fat Example Are Given Below Find The Best Biasing Constant A 1 (194.33 KiB) Viewed 24 times
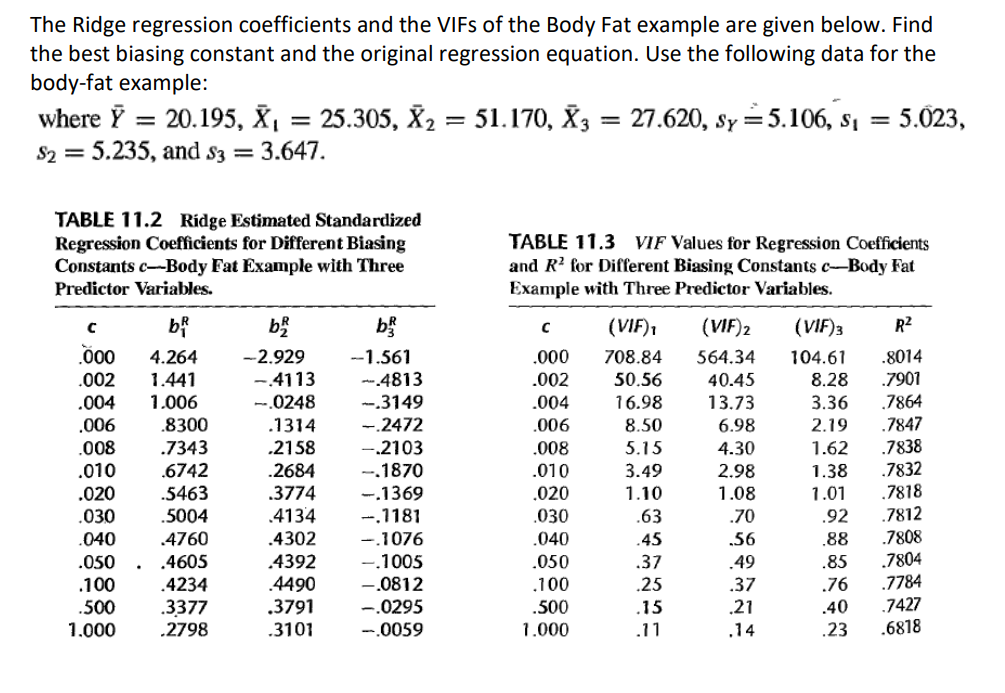
The Ridge regression coefficients and the VIFs of the Body Fat example are given below. Find the best biasing constant and the original regression equation. Use the following data for the body-fat example: where 7 = 20.195, X, 25.305, X2 = 51.170, X3 27.620, Sy = 5.106, si = 5.023, S2 = 5.235, and S3 = 3.647. = TABLE 11.2 Ridge Estimated Standardized Regression Coefficients for Different Biasing Constants c--Body Fat Example with Three Predictor Variables. b. C 000 .002 .004 .006 .008 .010 .020 .030 .040 .050 .100 .500 1.000 bi 4.264 1.441 1.006 .8300 .7343 .6742 .5463 .5004 4760 .4605 4234 .3377 .2798 -2.929 - 4113 --0248 .1314 .2158 .2684 .3774 4134 .4302 4392 4490 .3791 .3101 ba -1.561 -.4813 -.3149 -2472 - 2103 -1870 -1369 -.1181 -.1076 - 1005 -.0812 -0295 -.0059 TABLE 11.3 VIF Values for Regression Coefficients and R for Different Biasing Constants -Body Fat Example with Three Predictor Variables. с (VIF), (VIF)2 (VIF)3 R2 .000 708.84 564.34 104.61 .8014 .002 50.56 40.45 8.28 .7901 .004 16.98 13.73 3.36 .7864 .006 8.50 6.98 2.19 .7847 .008 5.15 4.30 1.62 .7838 .010 3.49 2.98 1.38 .7832 .020 1.10 1.08 1.01 .7818 .030 .63 .70 .92 .7812 .040 .45 ,56 .88 .7808 .050 .37 .49 .85 .7804 .100 .25 .37 .76 .7784 .500 .15 .21 .40 7427 1.000 .11 .14 .23 .6818