Page 1 of 1
Bootstrap Dotplot of pr-2 Left Tail Two Tail Right Tail semples 1600 ma-0212 star-2029 40 30 20 0.025 ....... •••••••• 0
Posted: Wed May 11, 2022 12:58 pm
by answerhappygod
- Bootstrap Dotplot Of Pr 2 Left Tail Two Tail Right Tail Semples 1600 Ma 0212 Star 2029 40 30 20 0 025 0 1 (407.16 KiB) Viewed 24 times
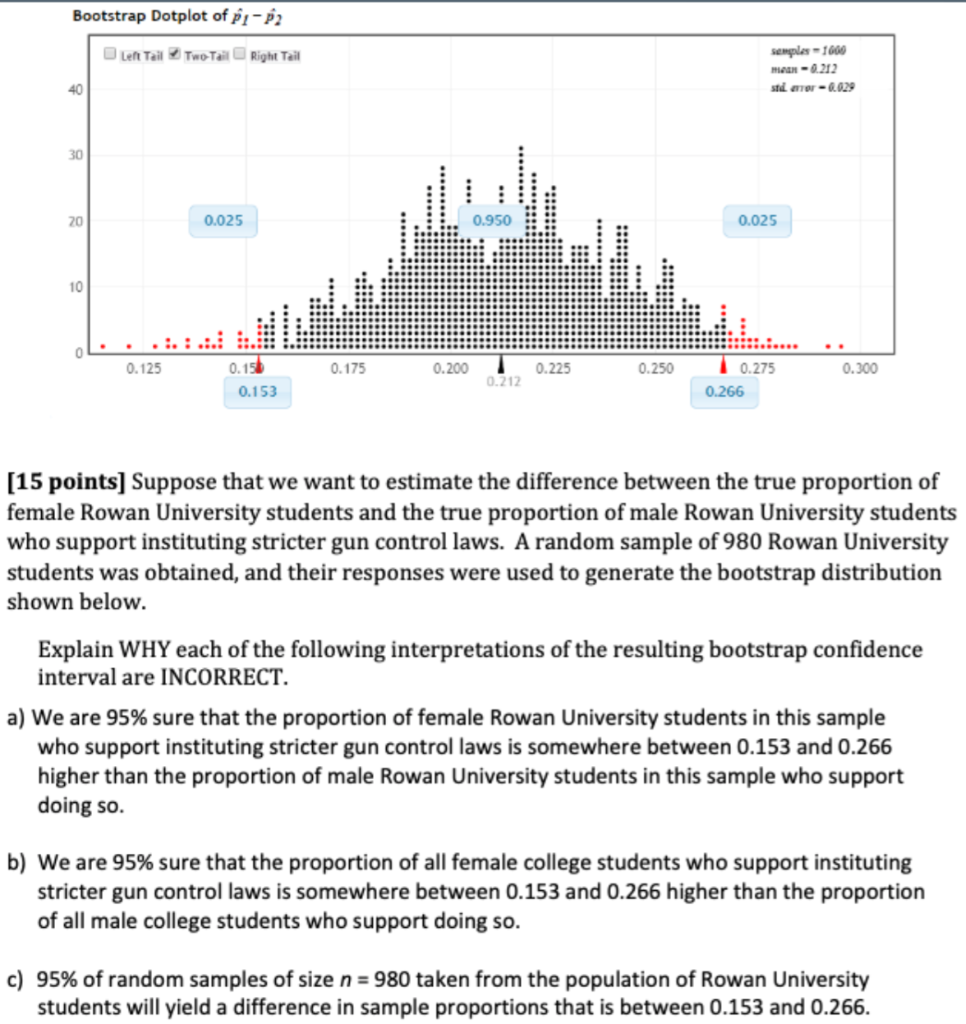
Bootstrap Dotplot of pr-2 Left Tail Two Tail Right Tail semples 1600 ma-0212 star-2029 40 30 20 0.025 ....... •••••••• 0.950 0.025 10 0.125 0.175 0.200 0.225 0.250 0.300 0.154 0.153 0.212 0.275 0.266 [15 points] Suppose that we want to estimate the difference between the true proportion of female Rowan University students and the true proportion of male Rowan University students who support instituting stricter gun control laws. A random sample of 980 Rowan University students was obtained, and their responses were used to generate the bootstrap distribution shown below. Explain WHY each of the following interpretations of the resulting bootstrap confidence interval are INCORRECT. a) We are 95% sure that the proportion of female Rowan University students in this sample who support instituting stricter gun control laws is somewhere between 0.153 and 0.266 higher than the proportion of male Rowan University students in this sample who support doing so. b) We are 95% sure that the proportion of all female college students who support instituting stricter gun control laws is somewhere between 0.153 and 0.266 higher than the proportion of all male college students who support doing so. c) 95% of random samples of size n = 980 taken from the population of Rowan University students will yield a difference in sample proportions that is between 0.153 and 0.266.