Page 1 of 1
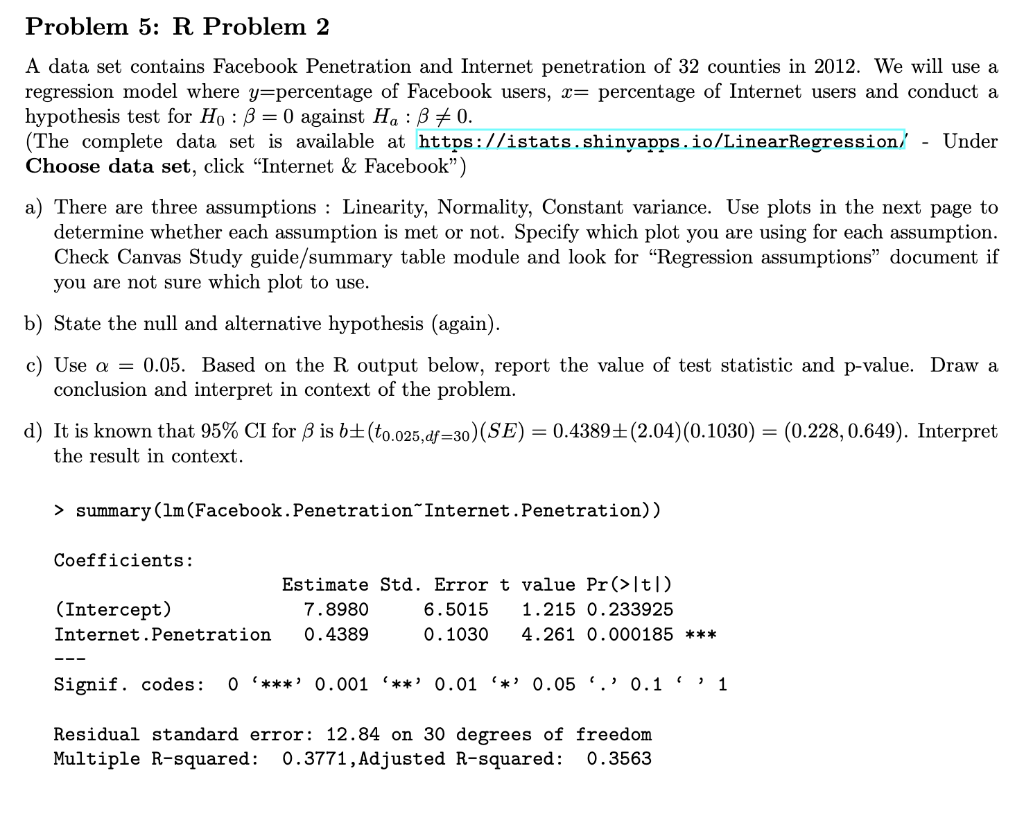
Problem 5: R Problem 2 A data set contains Facebook Penetration and Internet penetration of 32 counties in 2012. We will
Posted: Wed May 11, 2022 12:08 pm
by answerhappygod
- Problem 5 R Problem 2 A Data Set Contains Facebook Penetration And Internet Penetration Of 32 Counties In 2012 We Will 1 (198.17 KiB) Viewed 38 times
Problem 5: R Problem 2 A data set contains Facebook Penetration and Internet penetration of 32 counties in 2012. We will use a regression model where y=percentage of Facebook users, x= percentage of Internet users and conduct a hypothesis test for H :B = 0 against H:8 +0. (The complete data set is available at
https://istats.shinyapps.io/LinearRegression/ - Under Choose data set, click “Internet & Facebook") a) There are three assumptions : Linearity, Normality, Constant variance. Use plots in the next page to determine whether each assumption is met or not. Specify which plot you are using for each assumption. Check Canvas Study guide/summary table module and look for "Regression assumptions” document if you are not sure which plot to use. b) State the null and alternative hypothesis (again). c) Use a = 0.05. Based on the R output below, report the value of test statistic and p-value. Draw a conclusion and interpret in context of the problem. d) It is known that 95% CI for ß is bĚ(10.025,df=30)(SE) = 0.4389+(2.04)(0.1030) = (0.228, 0.649). Interpret the result in context. > summary (1m (Facebook. Penetration Internet. Penetration)) Coefficients: (Intercept) Internet. Penetration Estimate Std. Error t value Pr(>ltl) 7.8980 6.5015 1.215 0.233925 0.4389 0.1030 4.261 0.000185 *** Signif. codes: O ****' 0.001 '**' 0.01 *' 0.05.' 0.1'1 Residual standard error: 12.84 on 30 degrees of freedom Multiple R-squared: 0.3771, Adjusted R-squared: 0.3563
Normal Q-Q 2 o O. - OO 00000000000 O 0 Standardized residuals OOOOO -1 z 70 230 016 1 1 -2 -1 0 0 2 Theoretical Quantiles Im(Facebook.Penetration - Internet.Penetration) Residuals vs Fitted 20 o o o o 10 0 Po 0 o O o O O U 4 O O o Residuals O O o -10 o -20 07 023 30 160 1 1 T 1 15 20 25 30 35 40 45 50 Fitted values Im(Facebook. Penetration - Internet. Penetration) Scatter plot o 50 o O O o o o O o O O 40 Facebook.Penetration 30 10 20 o O o o 20 40 60 80 Internet. Penetration