Page 1 of 1
IN A Quality department is interested in using a control chart to monitor the occurrence of failures in a production pro
Posted: Wed May 11, 2022 9:43 am
by answerhappygod
- In A Quality Department Is Interested In Using A Control Chart To Monitor The Occurrence Of Failures In A Production Pro 1 (119.97 KiB) Viewed 24 times
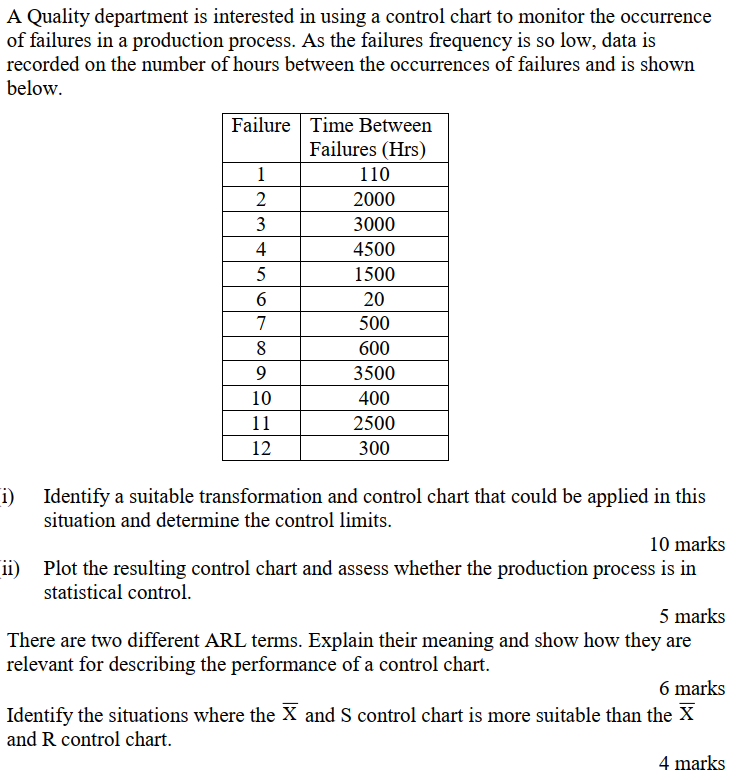
IN A Quality department is interested in using a control chart to monitor the occurrence of failures in a production process. As the failures frequency is so low, data is recorded on the number of hours between the occurrences of failures and is shown below. Failure Time Between Failures (Hrs) 1 110 2 2000 3 3000 4 4500 5 1500 6 20 7 500 8 600 9 3500 10 400 11 2500 12 300 i) Identify a suitable transformation and control chart that could be applied in this situation and determine the control limits. 10 marks ii) Plot the resulting control chart and assess whether the production process is in statistical control. 5 marks There are two different ARL terms. Explain their meaning and show how they are relevant for describing the performance of a control chart. 6 marks Identify the situations where the X and S control chart is more suitable than the X and R control chart. 4 marks