Page 1 of 1
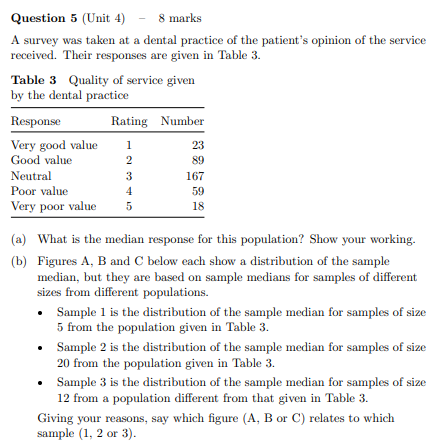
Question 5 (Unit 4) - 8 marks A survey was taken at a dental practice of the patient's opinion of the service received.
Posted: Wed May 11, 2022 9:22 am
by answerhappygod
- Question 5 Unit 4 8 Marks A Survey Was Taken At A Dental Practice Of The Patient S Opinion Of The Service Received 1 (66.84 KiB) Viewed 29 times
- Question 5 Unit 4 8 Marks A Survey Was Taken At A Dental Practice Of The Patient S Opinion Of The Service Received 2 (26.34 KiB) Viewed 29 times
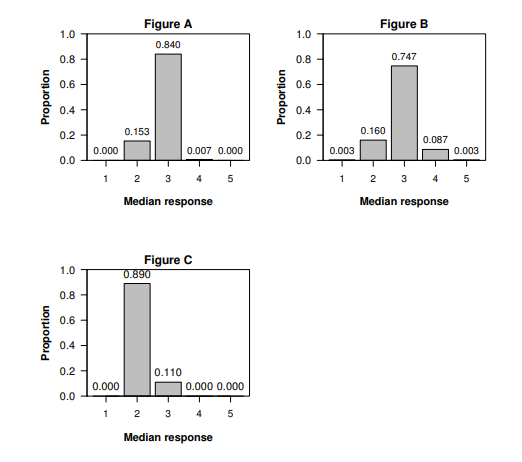
Question 5 (Unit 4) - 8 marks A survey was taken at a dental practice of the patient's opinion of the service received. Their responses are given in Table 3. Table 3 Quality of service given by the dental practice Response Rating Number Very good value 1 23 Good value 89 Neutral 3 167 Poor value 59 Very poor value 5 18 2 یا ث حظر ال 4 (a) What is the median response for this population? Show your working. (b) Figures A, B and C below each show a distribution of the sample median, but they are based on sample medians for samples of different sizes from different populations. • Sample 1 is the distribution of the sample median for samples of size 5 from the population given in Table 3. • Sample 2 is the distribution of the sample median for samples of size 20 from the population given in Table 3. • Sample 3 is the distribution of the sample median for samples of size 12 from a population different from that given in Table 3. Giving your reasons, say which figure (A, B or C) relates to which sample (1, 2 or 3).
Figure B 1.0 Figure A 0.840 1.0 0.8 - 0.8 0.747 0.6 - 0.6 Proportion Proportion 0.4 - 0.4 0.2 0.153 0.21 0.160 0.087 0.000 0.007 0.000 0.003 0.003 0.0 0.0 3 5 1 2 3 4 5 Median response 1 2 3 4 Median response 1.0 Figure C 0.890 0.8 0.6 - Proportion 0.4 - 0.2- 0.000 0.110 0.000 0.000 0.0 1 2 3 4 5 Median response