Page 1 of 1
Coffee Temperature 180 170 160 Temperature (Fahrenheit) Temperature 150 140 130 1 6 11 16 21 26 Time (hours) The data pl
Posted: Wed May 11, 2022 8:17 am
by answerhappygod
- Coffee Temperature 180 170 160 Temperature Fahrenheit Temperature 150 140 130 1 6 11 16 21 26 Time Hours The Data Pl 1 (60.21 KiB) Viewed 35 times
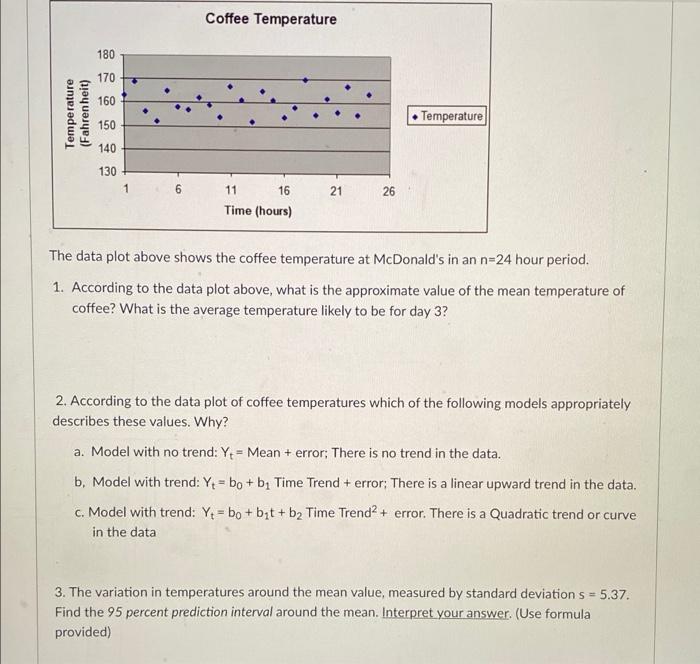
Coffee Temperature 180 170 160 Temperature (Fahrenheit) Temperature 150 140 130 1 6 11 16 21 26 Time (hours) The data plot above shows the coffee temperature at McDonald's in an n=24 hour period. 1. According to the data plot above, what is the approximate value of the mean temperature of coffee? What is the average temperature likely to be for day 3? 2. According to the data plot of coffee temperatures which of the following models appropriately describes these values. Why? a. Model with no trend: Y = Mean + error: There is no trend in the data. b. Model with trend: Y = bo + b Time Trend + error: There is a linear upward trend in the data. c. Model with trend: Y = bo+bit + b2 Time Trend? + error. There is a Quadratic trend or curve in the data + 3. The variation in temperatures around the mean value, measured by standard deviation s = 5.37. Find the 95 percent prediction interval around the mean. Interpret your answer. (Use formula provided)