Page 1 of 1
A researcher claims that the numbers of cups of coffee U.S. adults drink per day distributed as shown in the figure. You
Posted: Wed May 11, 2022 8:10 am
by answerhappygod
- A Researcher Claims That The Numbers Of Cups Of Coffee U S Adults Drink Per Day Distributed As Shown In The Figure You 1 (66.13 KiB) Viewed 23 times
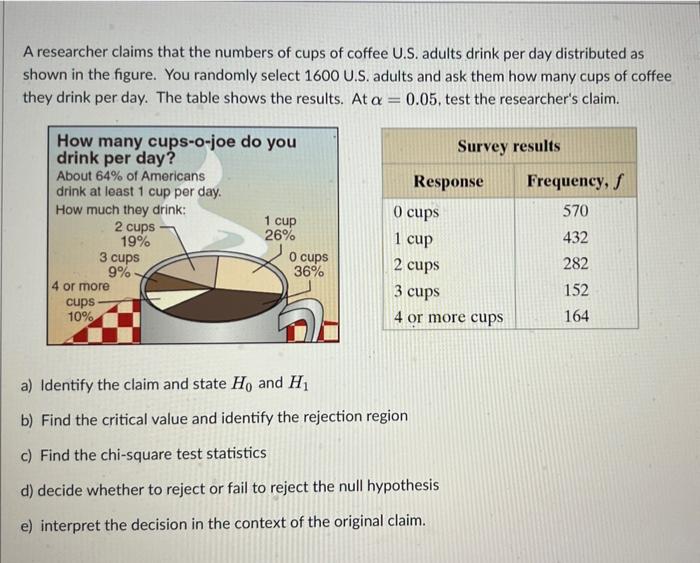
A researcher claims that the numbers of cups of coffee U.S. adults drink per day distributed as shown in the figure. You randomly select 1600 U.S. adults and ask them how many cups of coffee they drink per day. The table shows the results. At a = 0.05, test the researcher's claim. Survey results Response How many cups-o-joe do you drink per day? About 64% of Americans drink at least 1 cup per day. How much they drink: 1 cup 2 cups 26% 19% 3 cups 0 cups 9% 36% 4 or more cups 10% 0 cups 1 cup 2 cups 3 cups Frequency, S 570 432 282 152 164 4 or more cups a) Identify the claim and state Ho and H b) Find the critical value and identify the rejection region c) Find the chi-square test statistics d) decide whether to reject or fail to reject the null hypothesis e) interpret the decision in the context of the original claim.